Guatemalan vs Ugandan Single Father Poverty
COMPARE
Guatemalan
Ugandan
Single Father Poverty
Single Father Poverty Comparison
Guatemalans
Ugandans
16.6%
SINGLE FATHER POVERTY
12.9/ 100
METRIC RATING
210th/ 347
METRIC RANK
16.3%
SINGLE FATHER POVERTY
55.9/ 100
METRIC RATING
162nd/ 347
METRIC RANK
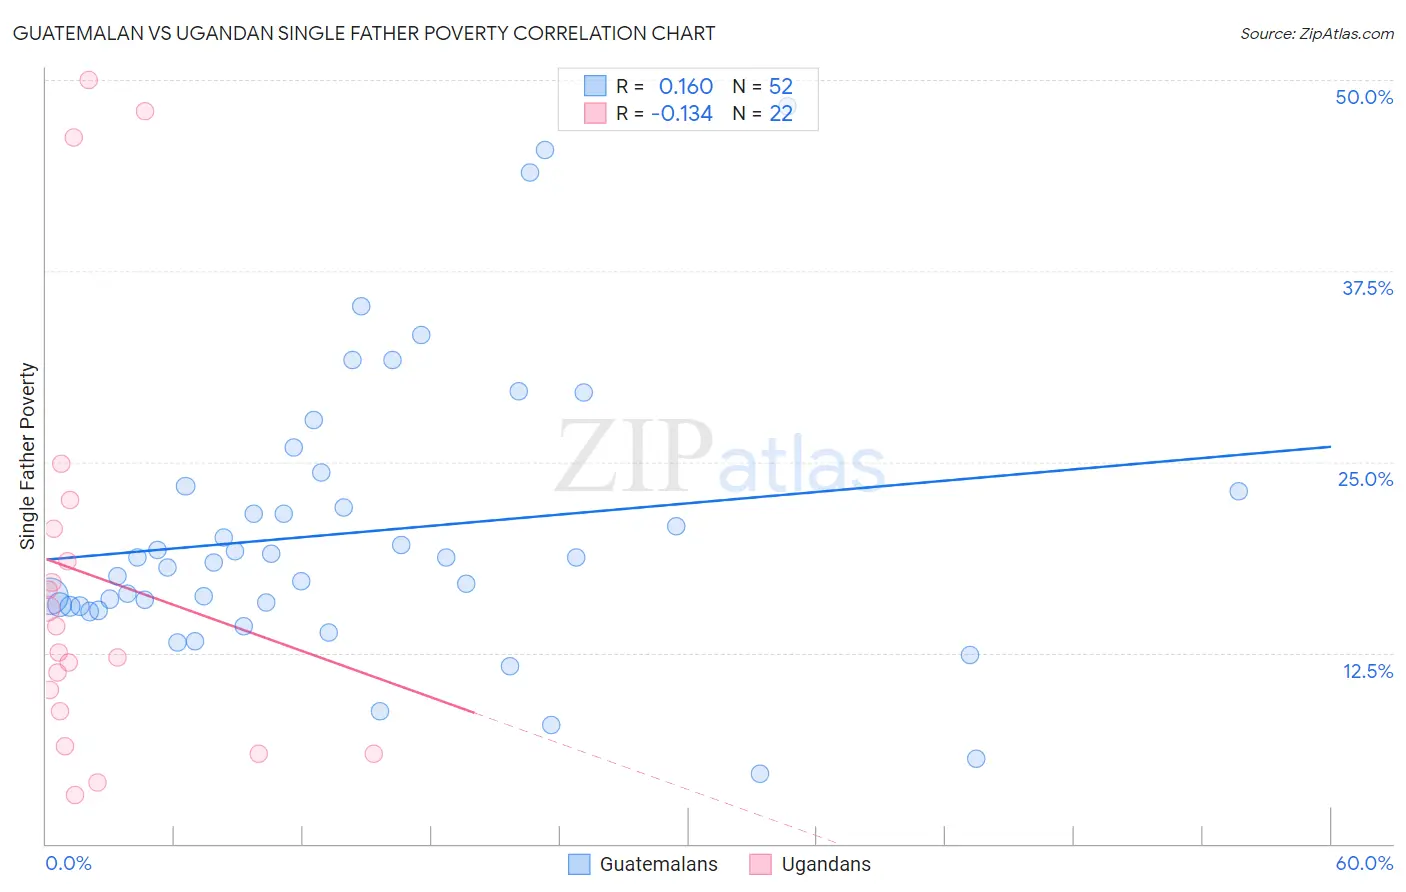
Guatemalan vs Ugandan Single Father Poverty Correlation Chart
The statistical analysis conducted on geographies consisting of 326,782,810 people shows a poor positive correlation between the proportion of Guatemalans and poverty level among single fathers in the United States with a correlation coefficient (R) of 0.160 and weighted average of 16.6%. Similarly, the statistical analysis conducted on geographies consisting of 87,224,974 people shows a poor negative correlation between the proportion of Ugandans and poverty level among single fathers in the United States with a correlation coefficient (R) of -0.134 and weighted average of 16.3%, a difference of 2.4%.
Single Father Poverty Correlation Summary
| Measurement | Guatemalan | Ugandan |
| Minimum | 4.6% | 3.2% |
| Maximum | 48.3% | 50.0% |
| Range | 43.7% | 46.8% |
| Mean | 20.4% | 17.5% |
| Median | 18.6% | 13.4% |
| Interquartile 25% (IQ1) | 15.5% | 8.7% |
| Interquartile 75% (IQ3) | 23.2% | 20.6% |
| Interquartile Range (IQR) | 7.7% | 11.9% |
| Standard Deviation (Sample) | 9.1% | 13.7% |
| Standard Deviation (Population) | 9.1% | 13.4% |
Similar Demographics by Single Father Poverty
Demographics Similar to Guatemalans by Single Father Poverty
In terms of single father poverty, the demographic groups most similar to Guatemalans are Arab (16.6%, a difference of 0.0%), European (16.6%, a difference of 0.030%), New Zealander (16.6%, a difference of 0.070%), Eastern European (16.6%, a difference of 0.070%), and Immigrants from Senegal (16.6%, a difference of 0.080%).
| Demographics | Rating | Rank | Single Father Poverty |
| Immigrants | North America | 15.1 /100 | #203 | Poor 16.6% |
| Immigrants | Guatemala | 14.8 /100 | #204 | Poor 16.6% |
| Venezuelans | 14.3 /100 | #205 | Poor 16.6% |
| Immigrants | Senegal | 13.7 /100 | #206 | Poor 16.6% |
| New Zealanders | 13.7 /100 | #207 | Poor 16.6% |
| Eastern Europeans | 13.7 /100 | #208 | Poor 16.6% |
| Europeans | 13.2 /100 | #209 | Poor 16.6% |
| Guatemalans | 12.9 /100 | #210 | Poor 16.6% |
| Arabs | 12.8 /100 | #211 | Poor 16.6% |
| Immigrants | Southern Europe | 11.2 /100 | #212 | Poor 16.7% |
| Ghanaians | 11.0 /100 | #213 | Poor 16.7% |
| Spanish | 10.7 /100 | #214 | Poor 16.7% |
| Immigrants | Scotland | 9.6 /100 | #215 | Tragic 16.7% |
| Immigrants | England | 9.5 /100 | #216 | Tragic 16.7% |
| Cheyenne | 9.3 /100 | #217 | Tragic 16.7% |
Demographics Similar to Ugandans by Single Father Poverty
In terms of single father poverty, the demographic groups most similar to Ugandans are Immigrants from Costa Rica (16.3%, a difference of 0.010%), Guyanese (16.3%, a difference of 0.030%), Estonian (16.2%, a difference of 0.040%), Immigrants from Bangladesh (16.3%, a difference of 0.040%), and Immigrants from Europe (16.3%, a difference of 0.050%).
| Demographics | Rating | Rank | Single Father Poverty |
| Immigrants | Nicaragua | 67.8 /100 | #155 | Good 16.2% |
| Immigrants | Jordan | 66.0 /100 | #156 | Good 16.2% |
| Immigrants | Czechoslovakia | 62.8 /100 | #157 | Good 16.2% |
| Portuguese | 62.3 /100 | #158 | Good 16.2% |
| Belizeans | 59.9 /100 | #159 | Average 16.2% |
| Immigrants | Sudan | 59.8 /100 | #160 | Average 16.2% |
| Estonians | 56.7 /100 | #161 | Average 16.2% |
| Ugandans | 55.9 /100 | #162 | Average 16.3% |
| Immigrants | Costa Rica | 55.7 /100 | #163 | Average 16.3% |
| Guyanese | 55.2 /100 | #164 | Average 16.3% |
| Immigrants | Bangladesh | 55.1 /100 | #165 | Average 16.3% |
| Immigrants | Europe | 54.8 /100 | #166 | Average 16.3% |
| Yugoslavians | 53.9 /100 | #167 | Average 16.3% |
| Costa Ricans | 53.6 /100 | #168 | Average 16.3% |
| Northern Europeans | 52.8 /100 | #169 | Average 16.3% |