Immigrants from Venezuela vs Ugandan Single Father Poverty
COMPARE
Immigrants from Venezuela
Ugandan
Single Father Poverty
Single Father Poverty Comparison
Immigrants from Venezuela
Ugandans
16.4%
SINGLE FATHER POVERTY
31.0/ 100
METRIC RATING
186th/ 347
METRIC RANK
16.3%
SINGLE FATHER POVERTY
55.9/ 100
METRIC RATING
162nd/ 347
METRIC RANK
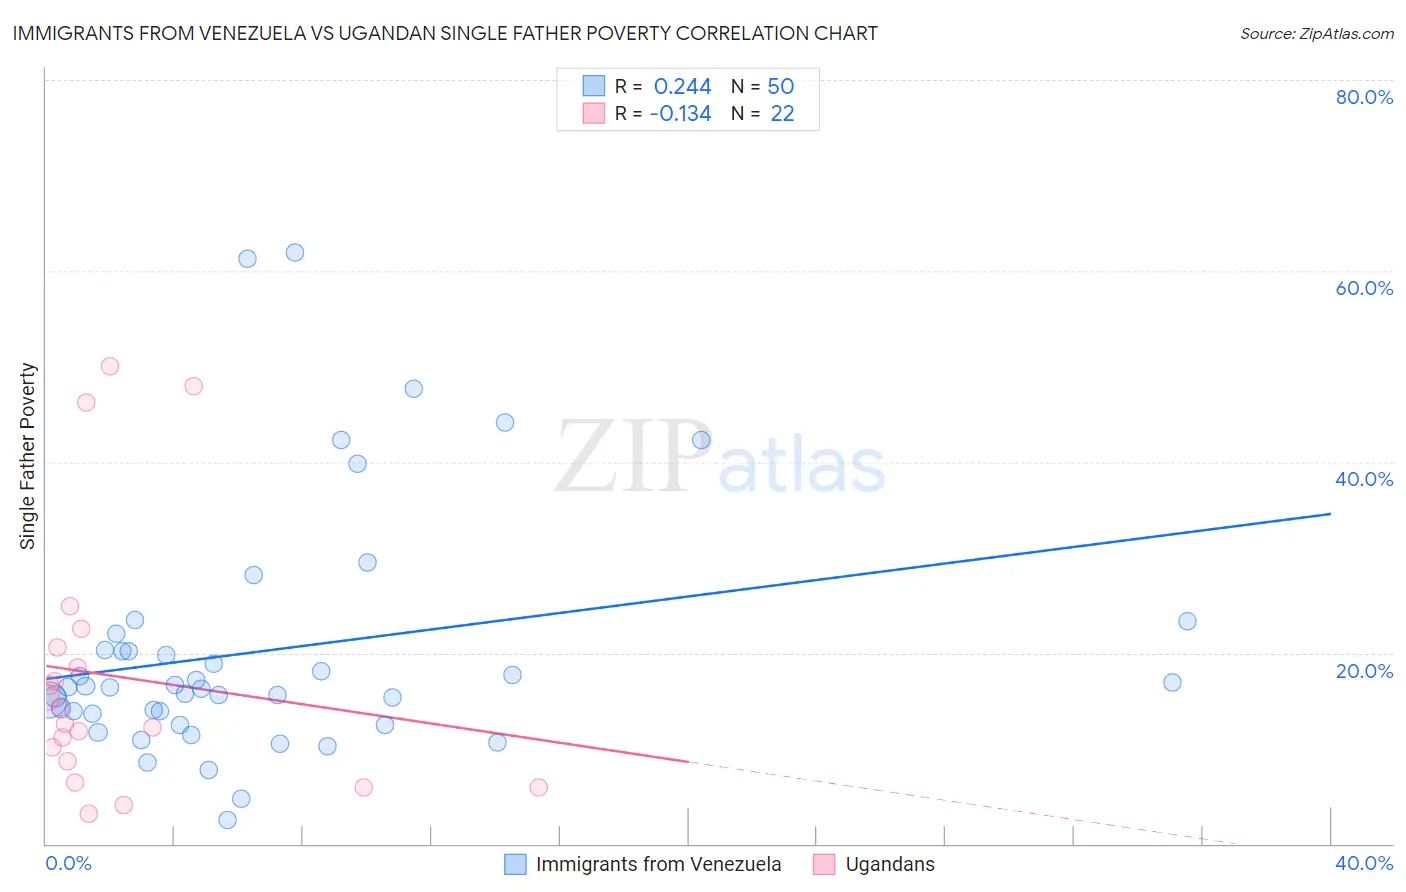
Immigrants from Venezuela vs Ugandan Single Father Poverty Correlation Chart
The statistical analysis conducted on geographies consisting of 236,867,266 people shows a weak positive correlation between the proportion of Immigrants from Venezuela and poverty level among single fathers in the United States with a correlation coefficient (R) of 0.244 and weighted average of 16.4%. Similarly, the statistical analysis conducted on geographies consisting of 87,224,974 people shows a poor negative correlation between the proportion of Ugandans and poverty level among single fathers in the United States with a correlation coefficient (R) of -0.134 and weighted average of 16.3%, a difference of 1.1%.
Single Father Poverty Correlation Summary
| Measurement | Immigrants from Venezuela | Ugandan |
| Minimum | 2.4% | 3.2% |
| Maximum | 61.9% | 50.0% |
| Range | 59.5% | 46.8% |
| Mean | 20.2% | 17.5% |
| Median | 16.4% | 13.4% |
| Interquartile 25% (IQ1) | 13.6% | 8.7% |
| Interquartile 75% (IQ3) | 20.3% | 20.6% |
| Interquartile Range (IQR) | 6.7% | 11.9% |
| Standard Deviation (Sample) | 12.9% | 13.7% |
| Standard Deviation (Population) | 12.8% | 13.4% |
Similar Demographics by Single Father Poverty
Demographics Similar to Immigrants from Venezuela by Single Father Poverty
In terms of single father poverty, the demographic groups most similar to Immigrants from Venezuela are Ukrainian (16.4%, a difference of 0.030%), Russian (16.4%, a difference of 0.050%), Latvian (16.5%, a difference of 0.11%), Panamanian (16.4%, a difference of 0.13%), and Immigrants from Burma/Myanmar (16.5%, a difference of 0.16%).
| Demographics | Rating | Rank | Single Father Poverty |
| Serbians | 40.9 /100 | #179 | Average 16.4% |
| Immigrants | Latin America | 37.2 /100 | #180 | Fair 16.4% |
| Immigrants | Western Africa | 36.0 /100 | #181 | Fair 16.4% |
| Immigrants | Italy | 35.7 /100 | #182 | Fair 16.4% |
| Aleuts | 35.3 /100 | #183 | Fair 16.4% |
| Cambodians | 34.6 /100 | #184 | Fair 16.4% |
| Panamanians | 33.6 /100 | #185 | Fair 16.4% |
| Immigrants | Venezuela | 31.0 /100 | #186 | Fair 16.4% |
| Ukrainians | 30.4 /100 | #187 | Fair 16.4% |
| Russians | 30.1 /100 | #188 | Fair 16.4% |
| Latvians | 28.9 /100 | #189 | Fair 16.5% |
| Immigrants | Burma/Myanmar | 28.0 /100 | #190 | Fair 16.5% |
| Immigrants | Guyana | 27.1 /100 | #191 | Fair 16.5% |
| Immigrants | Switzerland | 24.8 /100 | #192 | Fair 16.5% |
| Ecuadorians | 24.5 /100 | #193 | Fair 16.5% |
Demographics Similar to Ugandans by Single Father Poverty
In terms of single father poverty, the demographic groups most similar to Ugandans are Immigrants from Costa Rica (16.3%, a difference of 0.010%), Guyanese (16.3%, a difference of 0.030%), Estonian (16.2%, a difference of 0.040%), Immigrants from Bangladesh (16.3%, a difference of 0.040%), and Immigrants from Europe (16.3%, a difference of 0.050%).
| Demographics | Rating | Rank | Single Father Poverty |
| Immigrants | Nicaragua | 67.8 /100 | #155 | Good 16.2% |
| Immigrants | Jordan | 66.0 /100 | #156 | Good 16.2% |
| Immigrants | Czechoslovakia | 62.8 /100 | #157 | Good 16.2% |
| Portuguese | 62.3 /100 | #158 | Good 16.2% |
| Belizeans | 59.9 /100 | #159 | Average 16.2% |
| Immigrants | Sudan | 59.8 /100 | #160 | Average 16.2% |
| Estonians | 56.7 /100 | #161 | Average 16.2% |
| Ugandans | 55.9 /100 | #162 | Average 16.3% |
| Immigrants | Costa Rica | 55.7 /100 | #163 | Average 16.3% |
| Guyanese | 55.2 /100 | #164 | Average 16.3% |
| Immigrants | Bangladesh | 55.1 /100 | #165 | Average 16.3% |
| Immigrants | Europe | 54.8 /100 | #166 | Average 16.3% |
| Yugoslavians | 53.9 /100 | #167 | Average 16.3% |
| Costa Ricans | 53.6 /100 | #168 | Average 16.3% |
| Northern Europeans | 52.8 /100 | #169 | Average 16.3% |