Shoshone vs Immigrants from Guyana Single Father Poverty
COMPARE
Shoshone
Immigrants from Guyana
Single Father Poverty
Single Father Poverty Comparison
Shoshone
Immigrants from Guyana
22.9%
SINGLE FATHER POVERTY
0.0/ 100
METRIC RATING
335th/ 347
METRIC RANK
16.5%
SINGLE FATHER POVERTY
27.1/ 100
METRIC RATING
191st/ 347
METRIC RANK
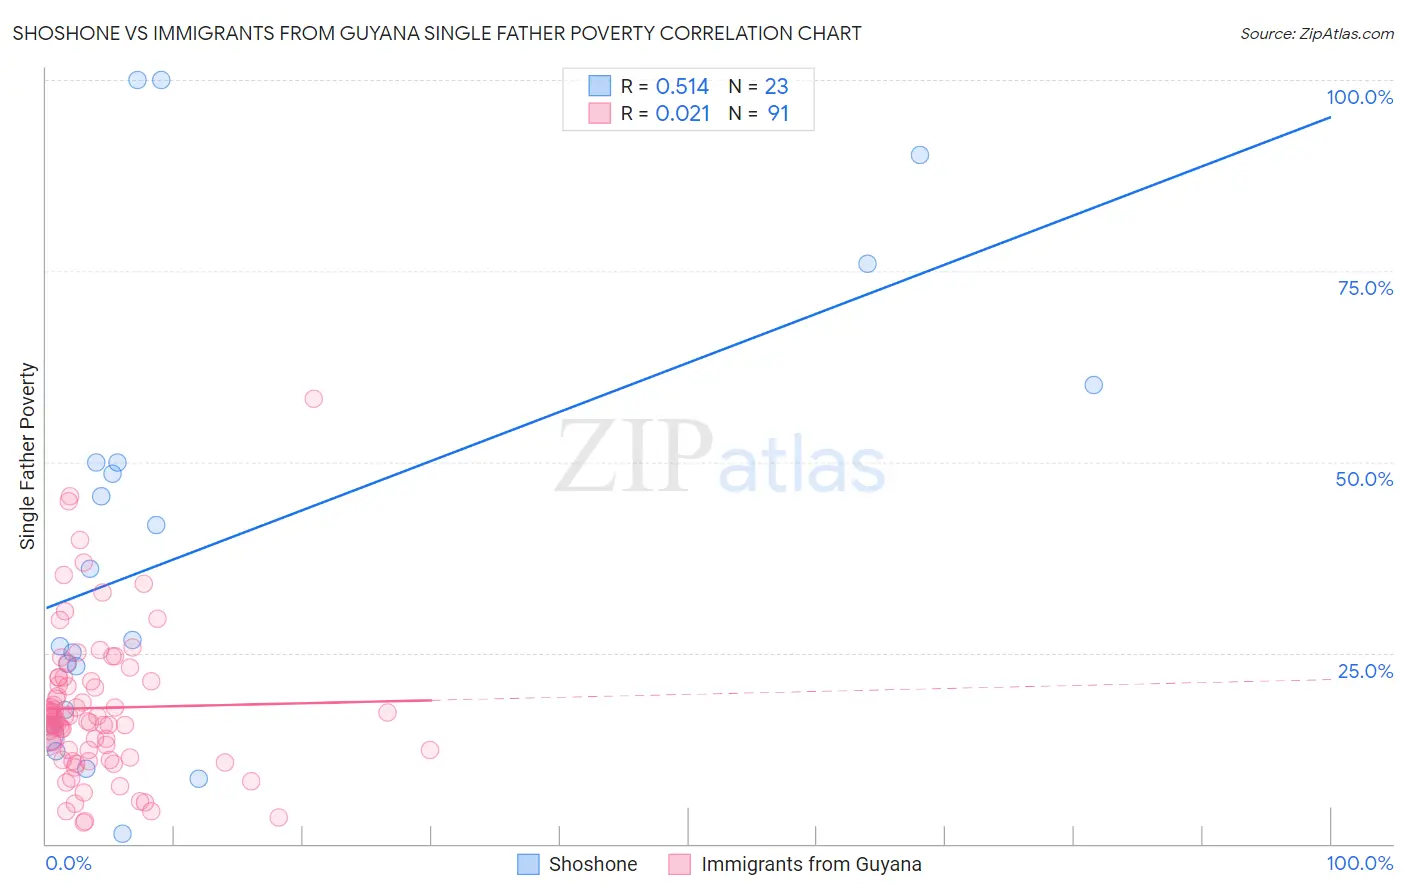
Shoshone vs Immigrants from Guyana Single Father Poverty Correlation Chart
The statistical analysis conducted on geographies consisting of 62,234,172 people shows a substantial positive correlation between the proportion of Shoshone and poverty level among single fathers in the United States with a correlation coefficient (R) of 0.514 and weighted average of 22.9%. Similarly, the statistical analysis conducted on geographies consisting of 157,234,374 people shows no correlation between the proportion of Immigrants from Guyana and poverty level among single fathers in the United States with a correlation coefficient (R) of 0.021 and weighted average of 16.5%, a difference of 39.1%.
Single Father Poverty Correlation Summary
| Measurement | Shoshone | Immigrants from Guyana |
| Minimum | 1.4% | 2.8% |
| Maximum | 100.0% | 58.2% |
| Range | 98.6% | 55.4% |
| Mean | 39.2% | 17.8% |
| Median | 26.6% | 16.3% |
| Interquartile 25% (IQ1) | 15.5% | 12.2% |
| Interquartile 75% (IQ3) | 50.0% | 21.3% |
| Interquartile Range (IQR) | 34.5% | 9.1% |
| Standard Deviation (Sample) | 29.3% | 9.7% |
| Standard Deviation (Population) | 28.6% | 9.6% |
Similar Demographics by Single Father Poverty
Demographics Similar to Shoshone by Single Father Poverty
In terms of single father poverty, the demographic groups most similar to Shoshone are Cajun (23.1%, a difference of 0.71%), Kiowa (22.5%, a difference of 2.0%), Native/Alaskan (22.4%, a difference of 2.3%), Tohono O'odham (22.0%, a difference of 4.1%), and Sioux (23.9%, a difference of 4.2%).
| Demographics | Rating | Rank | Single Father Poverty |
| Pueblo | 0.0 /100 | #328 | Tragic 21.1% |
| Colville | 0.0 /100 | #329 | Tragic 21.4% |
| Paiute | 0.0 /100 | #330 | Tragic 21.6% |
| Central American Indians | 0.0 /100 | #331 | Tragic 21.7% |
| Tohono O'odham | 0.0 /100 | #332 | Tragic 22.0% |
| Natives/Alaskans | 0.0 /100 | #333 | Tragic 22.4% |
| Kiowa | 0.0 /100 | #334 | Tragic 22.5% |
| Shoshone | 0.0 /100 | #335 | Tragic 22.9% |
| Cajuns | 0.0 /100 | #336 | Tragic 23.1% |
| Sioux | 0.0 /100 | #337 | Tragic 23.9% |
| Arapaho | 0.0 /100 | #338 | Tragic 24.0% |
| Apache | 0.0 /100 | #339 | Tragic 24.2% |
| Houma | 0.0 /100 | #340 | Tragic 26.7% |
| Hopi | 0.0 /100 | #341 | Tragic 27.2% |
| Yuman | 0.0 /100 | #342 | Tragic 28.4% |
Demographics Similar to Immigrants from Guyana by Single Father Poverty
In terms of single father poverty, the demographic groups most similar to Immigrants from Guyana are Immigrants from Burma/Myanmar (16.5%, a difference of 0.050%), Latvian (16.5%, a difference of 0.10%), Immigrants from Switzerland (16.5%, a difference of 0.13%), Ecuadorian (16.5%, a difference of 0.15%), and Russian (16.4%, a difference of 0.16%).
| Demographics | Rating | Rank | Single Father Poverty |
| Cambodians | 34.6 /100 | #184 | Fair 16.4% |
| Panamanians | 33.6 /100 | #185 | Fair 16.4% |
| Immigrants | Venezuela | 31.0 /100 | #186 | Fair 16.4% |
| Ukrainians | 30.4 /100 | #187 | Fair 16.4% |
| Russians | 30.1 /100 | #188 | Fair 16.4% |
| Latvians | 28.9 /100 | #189 | Fair 16.5% |
| Immigrants | Burma/Myanmar | 28.0 /100 | #190 | Fair 16.5% |
| Immigrants | Guyana | 27.1 /100 | #191 | Fair 16.5% |
| Immigrants | Switzerland | 24.8 /100 | #192 | Fair 16.5% |
| Ecuadorians | 24.5 /100 | #193 | Fair 16.5% |
| Cape Verdeans | 24.4 /100 | #194 | Fair 16.5% |
| Immigrants | Barbados | 24.3 /100 | #195 | Fair 16.5% |
| Immigrants | Canada | 21.9 /100 | #196 | Fair 16.5% |
| Immigrants | Northern Europe | 20.3 /100 | #197 | Fair 16.5% |
| Romanians | 20.1 /100 | #198 | Fair 16.5% |