Burmese vs Ugandan Single Father Poverty
COMPARE
Burmese
Ugandan
Single Father Poverty
Single Father Poverty Comparison
Burmese
Ugandans
15.5%
SINGLE FATHER POVERTY
99.0/ 100
METRIC RATING
88th/ 347
METRIC RANK
16.3%
SINGLE FATHER POVERTY
55.9/ 100
METRIC RATING
162nd/ 347
METRIC RANK
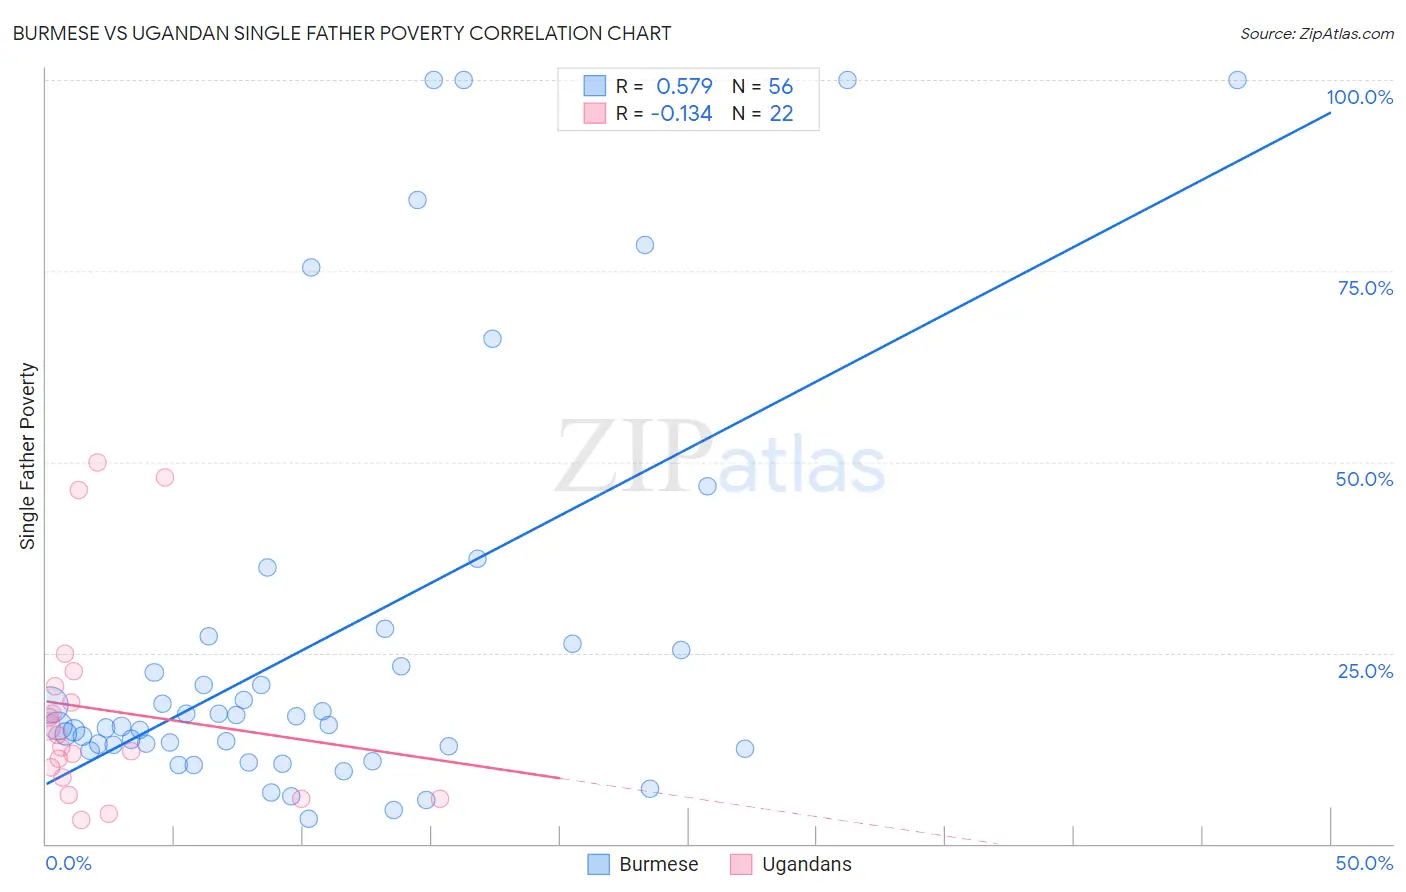
Burmese vs Ugandan Single Father Poverty Correlation Chart
The statistical analysis conducted on geographies consisting of 355,001,827 people shows a substantial positive correlation between the proportion of Burmese and poverty level among single fathers in the United States with a correlation coefficient (R) of 0.579 and weighted average of 15.5%. Similarly, the statistical analysis conducted on geographies consisting of 87,224,974 people shows a poor negative correlation between the proportion of Ugandans and poverty level among single fathers in the United States with a correlation coefficient (R) of -0.134 and weighted average of 16.3%, a difference of 5.1%.
Single Father Poverty Correlation Summary
| Measurement | Burmese | Ugandan |
| Minimum | 3.2% | 3.2% |
| Maximum | 100.0% | 50.0% |
| Range | 96.8% | 46.8% |
| Mean | 26.6% | 17.5% |
| Median | 15.4% | 13.4% |
| Interquartile 25% (IQ1) | 12.7% | 8.7% |
| Interquartile 75% (IQ3) | 25.9% | 20.6% |
| Interquartile Range (IQR) | 13.2% | 11.9% |
| Standard Deviation (Sample) | 26.9% | 13.7% |
| Standard Deviation (Population) | 26.7% | 13.4% |
Similar Demographics by Single Father Poverty
Demographics Similar to Burmese by Single Father Poverty
In terms of single father poverty, the demographic groups most similar to Burmese are Brazilian (15.5%, a difference of 0.030%), Immigrants from Russia (15.5%, a difference of 0.040%), Immigrants from Korea (15.5%, a difference of 0.060%), Immigrants from Oceania (15.4%, a difference of 0.16%), and Peruvian (15.4%, a difference of 0.28%).
| Demographics | Rating | Rank | Single Father Poverty |
| Immigrants | Congo | 99.4 /100 | #81 | Exceptional 15.4% |
| Immigrants | Ukraine | 99.4 /100 | #82 | Exceptional 15.4% |
| Chinese | 99.3 /100 | #83 | Exceptional 15.4% |
| Peruvians | 99.2 /100 | #84 | Exceptional 15.4% |
| Immigrants | Oceania | 99.1 /100 | #85 | Exceptional 15.4% |
| Immigrants | Russia | 99.0 /100 | #86 | Exceptional 15.5% |
| Brazilians | 99.0 /100 | #87 | Exceptional 15.5% |
| Burmese | 99.0 /100 | #88 | Exceptional 15.5% |
| Immigrants | Korea | 99.0 /100 | #89 | Exceptional 15.5% |
| Mexican American Indians | 98.7 /100 | #90 | Exceptional 15.5% |
| Immigrants | Romania | 98.6 /100 | #91 | Exceptional 15.5% |
| Immigrants | Serbia | 98.5 /100 | #92 | Exceptional 15.5% |
| Basques | 98.4 /100 | #93 | Exceptional 15.5% |
| Immigrants | Uruguay | 98.2 /100 | #94 | Exceptional 15.6% |
| Immigrants | Kazakhstan | 98.2 /100 | #95 | Exceptional 15.6% |
Demographics Similar to Ugandans by Single Father Poverty
In terms of single father poverty, the demographic groups most similar to Ugandans are Immigrants from Costa Rica (16.3%, a difference of 0.010%), Guyanese (16.3%, a difference of 0.030%), Estonian (16.2%, a difference of 0.040%), Immigrants from Bangladesh (16.3%, a difference of 0.040%), and Immigrants from Europe (16.3%, a difference of 0.050%).
| Demographics | Rating | Rank | Single Father Poverty |
| Immigrants | Nicaragua | 67.8 /100 | #155 | Good 16.2% |
| Immigrants | Jordan | 66.0 /100 | #156 | Good 16.2% |
| Immigrants | Czechoslovakia | 62.8 /100 | #157 | Good 16.2% |
| Portuguese | 62.3 /100 | #158 | Good 16.2% |
| Belizeans | 59.9 /100 | #159 | Average 16.2% |
| Immigrants | Sudan | 59.8 /100 | #160 | Average 16.2% |
| Estonians | 56.7 /100 | #161 | Average 16.2% |
| Ugandans | 55.9 /100 | #162 | Average 16.3% |
| Immigrants | Costa Rica | 55.7 /100 | #163 | Average 16.3% |
| Guyanese | 55.2 /100 | #164 | Average 16.3% |
| Immigrants | Bangladesh | 55.1 /100 | #165 | Average 16.3% |
| Immigrants | Europe | 54.8 /100 | #166 | Average 16.3% |
| Yugoslavians | 53.9 /100 | #167 | Average 16.3% |
| Costa Ricans | 53.6 /100 | #168 | Average 16.3% |
| Northern Europeans | 52.8 /100 | #169 | Average 16.3% |