Shoshone vs Immigrants from Western Europe Single Father Poverty
COMPARE
Shoshone
Immigrants from Western Europe
Single Father Poverty
Single Father Poverty Comparison
Shoshone
Immigrants from Western Europe
22.9%
SINGLE FATHER POVERTY
0.0/ 100
METRIC RATING
335th/ 347
METRIC RANK
16.9%
SINGLE FATHER POVERTY
2.9/ 100
METRIC RATING
235th/ 347
METRIC RANK
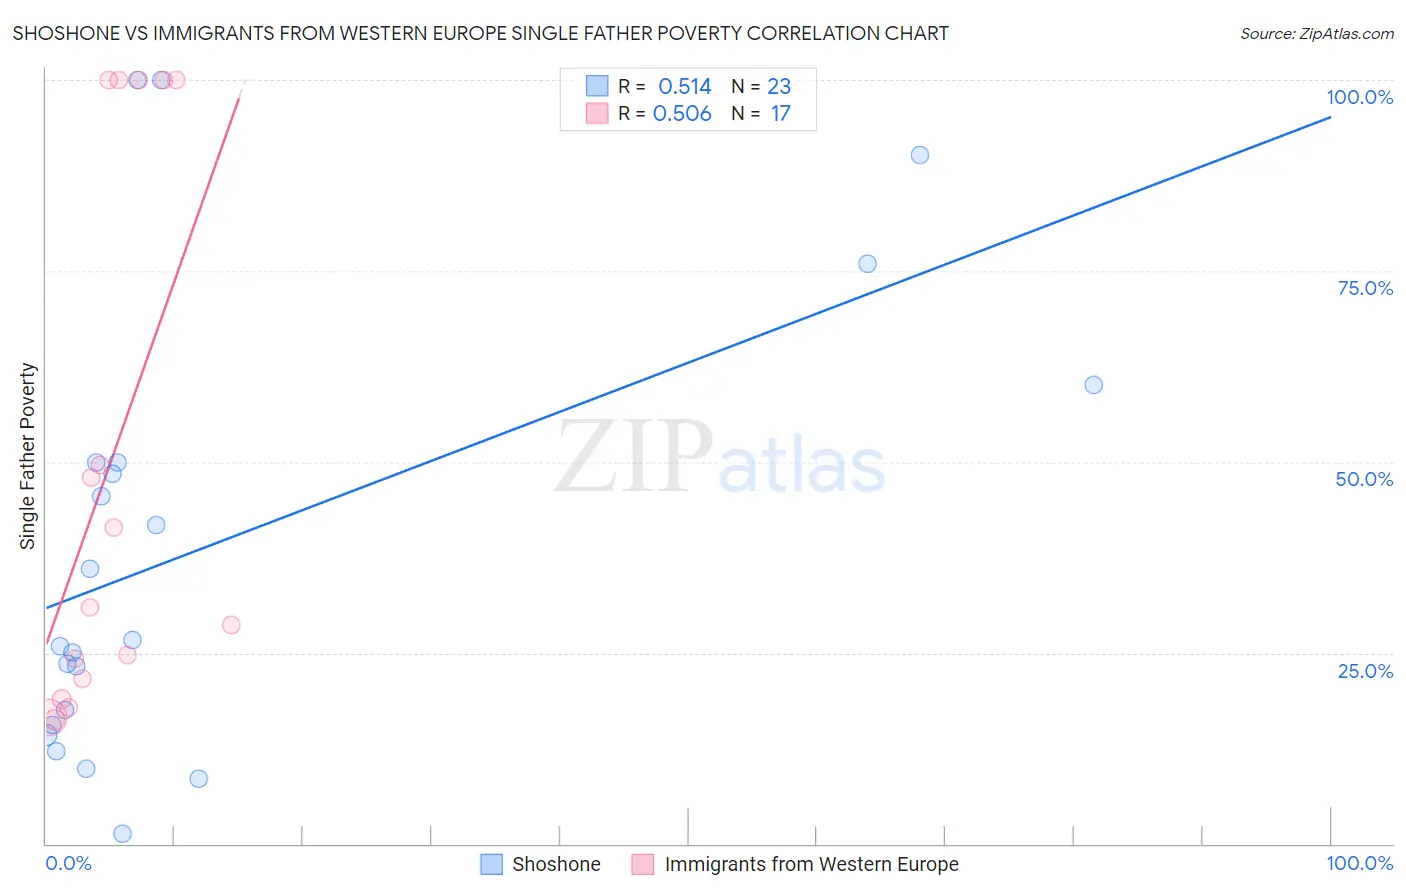
Shoshone vs Immigrants from Western Europe Single Father Poverty Correlation Chart
The statistical analysis conducted on geographies consisting of 62,234,172 people shows a substantial positive correlation between the proportion of Shoshone and poverty level among single fathers in the United States with a correlation coefficient (R) of 0.514 and weighted average of 22.9%. Similarly, the statistical analysis conducted on geographies consisting of 371,259,131 people shows a substantial positive correlation between the proportion of Immigrants from Western Europe and poverty level among single fathers in the United States with a correlation coefficient (R) of 0.506 and weighted average of 16.9%, a difference of 35.3%.
Single Father Poverty Correlation Summary
| Measurement | Shoshone | Immigrants from Western Europe |
| Minimum | 1.4% | 16.2% |
| Maximum | 100.0% | 100.0% |
| Range | 98.6% | 83.8% |
| Mean | 39.2% | 49.3% |
| Median | 26.6% | 31.0% |
| Interquartile 25% (IQ1) | 15.5% | 20.2% |
| Interquartile 75% (IQ3) | 50.0% | 100.0% |
| Interquartile Range (IQR) | 34.5% | 79.8% |
| Standard Deviation (Sample) | 29.3% | 35.1% |
| Standard Deviation (Population) | 28.6% | 34.1% |
Similar Demographics by Single Father Poverty
Demographics Similar to Shoshone by Single Father Poverty
In terms of single father poverty, the demographic groups most similar to Shoshone are Cajun (23.1%, a difference of 0.71%), Kiowa (22.5%, a difference of 2.0%), Native/Alaskan (22.4%, a difference of 2.3%), Tohono O'odham (22.0%, a difference of 4.1%), and Sioux (23.9%, a difference of 4.2%).
| Demographics | Rating | Rank | Single Father Poverty |
| Pueblo | 0.0 /100 | #328 | Tragic 21.1% |
| Colville | 0.0 /100 | #329 | Tragic 21.4% |
| Paiute | 0.0 /100 | #330 | Tragic 21.6% |
| Central American Indians | 0.0 /100 | #331 | Tragic 21.7% |
| Tohono O'odham | 0.0 /100 | #332 | Tragic 22.0% |
| Natives/Alaskans | 0.0 /100 | #333 | Tragic 22.4% |
| Kiowa | 0.0 /100 | #334 | Tragic 22.5% |
| Shoshone | 0.0 /100 | #335 | Tragic 22.9% |
| Cajuns | 0.0 /100 | #336 | Tragic 23.1% |
| Sioux | 0.0 /100 | #337 | Tragic 23.9% |
| Arapaho | 0.0 /100 | #338 | Tragic 24.0% |
| Apache | 0.0 /100 | #339 | Tragic 24.2% |
| Houma | 0.0 /100 | #340 | Tragic 26.7% |
| Hopi | 0.0 /100 | #341 | Tragic 27.2% |
| Yuman | 0.0 /100 | #342 | Tragic 28.4% |
Demographics Similar to Immigrants from Western Europe by Single Father Poverty
In terms of single father poverty, the demographic groups most similar to Immigrants from Western Europe are Immigrants from Germany (16.9%, a difference of 0.0%), Subsaharan African (16.9%, a difference of 0.0%), Immigrants from Saudi Arabia (16.9%, a difference of 0.070%), Bermudan (16.9%, a difference of 0.090%), and Marshallese (16.9%, a difference of 0.10%).
| Demographics | Rating | Rank | Single Father Poverty |
| Belgians | 5.3 /100 | #228 | Tragic 16.8% |
| Israelis | 4.6 /100 | #229 | Tragic 16.8% |
| Immigrants | Trinidad and Tobago | 4.5 /100 | #230 | Tragic 16.8% |
| Spanish Americans | 3.7 /100 | #231 | Tragic 16.9% |
| Immigrants | Grenada | 3.7 /100 | #232 | Tragic 16.9% |
| Senegalese | 3.2 /100 | #233 | Tragic 16.9% |
| Marshallese | 3.1 /100 | #234 | Tragic 16.9% |
| Immigrants | Western Europe | 2.9 /100 | #235 | Tragic 16.9% |
| Immigrants | Germany | 2.9 /100 | #236 | Tragic 16.9% |
| Sub-Saharan Africans | 2.9 /100 | #237 | Tragic 16.9% |
| Immigrants | Saudi Arabia | 2.7 /100 | #238 | Tragic 16.9% |
| Bermudans | 2.6 /100 | #239 | Tragic 16.9% |
| Finns | 2.6 /100 | #240 | Tragic 16.9% |
| Czechs | 2.3 /100 | #241 | Tragic 17.0% |
| Moroccans | 2.1 /100 | #242 | Tragic 17.0% |