Shoshone vs Immigrants from Micronesia Receiving Food Stamps
COMPARE
Shoshone
Immigrants from Micronesia
Receiving Food Stamps
Receiving Food Stamps Comparison
Shoshone
Immigrants from Micronesia
12.4%
RECEIVING FOOD STAMPS
17.7/ 100
METRIC RATING
203rd/ 347
METRIC RANK
13.5%
RECEIVING FOOD STAMPS
1.3/ 100
METRIC RATING
239th/ 347
METRIC RANK
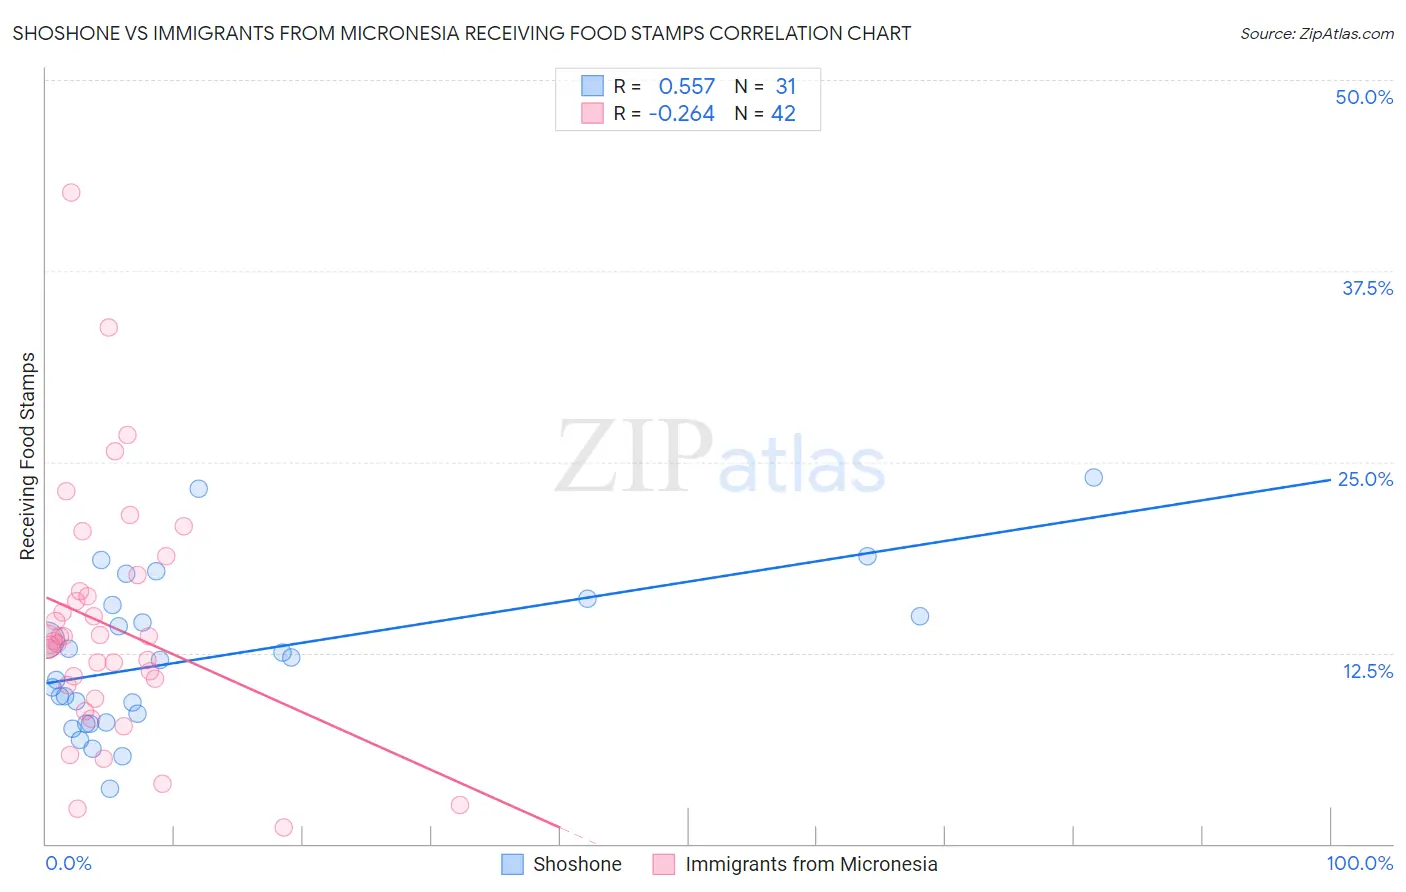
Shoshone vs Immigrants from Micronesia Receiving Food Stamps Correlation Chart
The statistical analysis conducted on geographies consisting of 66,597,434 people shows a substantial positive correlation between the proportion of Shoshone and percentage of population receiving government assistance and/or food stamps in the United States with a correlation coefficient (R) of 0.557 and weighted average of 12.4%. Similarly, the statistical analysis conducted on geographies consisting of 61,597,185 people shows a weak negative correlation between the proportion of Immigrants from Micronesia and percentage of population receiving government assistance and/or food stamps in the United States with a correlation coefficient (R) of -0.264 and weighted average of 13.5%, a difference of 9.2%.
Receiving Food Stamps Correlation Summary
| Measurement | Shoshone | Immigrants from Micronesia |
| Minimum | 3.6% | 1.1% |
| Maximum | 24.0% | 42.6% |
| Range | 20.4% | 41.5% |
| Mean | 12.2% | 14.3% |
| Median | 12.0% | 13.3% |
| Interquartile 25% (IQ1) | 7.9% | 10.4% |
| Interquartile 75% (IQ3) | 15.6% | 16.5% |
| Interquartile Range (IQR) | 7.7% | 6.1% |
| Standard Deviation (Sample) | 5.0% | 8.0% |
| Standard Deviation (Population) | 4.9% | 7.9% |
Similar Demographics by Receiving Food Stamps
Demographics Similar to Shoshone by Receiving Food Stamps
In terms of receiving food stamps, the demographic groups most similar to Shoshone are Nonimmigrants (12.4%, a difference of 0.030%), Aleut (12.4%, a difference of 0.090%), Immigrants from Thailand (12.4%, a difference of 0.16%), South American (12.4%, a difference of 0.42%), and Immigrants from Venezuela (12.3%, a difference of 0.53%).
| Demographics | Rating | Rank | Receiving Food Stamps |
| Iraqis | 26.6 /100 | #196 | Fair 12.2% |
| Delaware | 26.1 /100 | #197 | Fair 12.2% |
| Immigrants | Costa Rica | 25.4 /100 | #198 | Fair 12.2% |
| Portuguese | 25.1 /100 | #199 | Fair 12.2% |
| Sierra Leoneans | 23.6 /100 | #200 | Fair 12.2% |
| Ugandans | 22.5 /100 | #201 | Fair 12.2% |
| Immigrants | Venezuela | 20.1 /100 | #202 | Fair 12.3% |
| Shoshone | 17.7 /100 | #203 | Poor 12.4% |
| Immigrants | Nonimmigrants | 17.6 /100 | #204 | Poor 12.4% |
| Aleuts | 17.3 /100 | #205 | Poor 12.4% |
| Immigrants | Thailand | 17.0 /100 | #206 | Poor 12.4% |
| South Americans | 16.0 /100 | #207 | Poor 12.4% |
| Potawatomi | 14.6 /100 | #208 | Poor 12.5% |
| Immigrants | Sierra Leone | 12.9 /100 | #209 | Poor 12.5% |
| Immigrants | Uruguay | 12.8 /100 | #210 | Poor 12.5% |
Demographics Similar to Immigrants from Micronesia by Receiving Food Stamps
In terms of receiving food stamps, the demographic groups most similar to Immigrants from Micronesia are French American Indian (13.5%, a difference of 0.23%), Iroquois (13.5%, a difference of 0.30%), Immigrants from El Salvador (13.5%, a difference of 0.42%), Crow (13.4%, a difference of 0.65%), and Choctaw (13.6%, a difference of 0.73%).
| Demographics | Rating | Rank | Receiving Food Stamps |
| Salvadorans | 2.7 /100 | #232 | Tragic 13.2% |
| Cherokee | 2.5 /100 | #233 | Tragic 13.2% |
| Comanche | 2.4 /100 | #234 | Tragic 13.3% |
| Immigrants | Zaire | 1.9 /100 | #235 | Tragic 13.4% |
| Crow | 1.6 /100 | #236 | Tragic 13.4% |
| Immigrants | El Salvador | 1.5 /100 | #237 | Tragic 13.5% |
| French American Indians | 1.4 /100 | #238 | Tragic 13.5% |
| Immigrants | Micronesia | 1.3 /100 | #239 | Tragic 13.5% |
| Iroquois | 1.2 /100 | #240 | Tragic 13.5% |
| Choctaw | 1.0 /100 | #241 | Tragic 13.6% |
| Immigrants | Panama | 1.0 /100 | #242 | Tragic 13.6% |
| Somalis | 0.9 /100 | #243 | Tragic 13.7% |
| Cajuns | 0.9 /100 | #244 | Tragic 13.7% |
| Immigrants | Somalia | 0.9 /100 | #245 | Tragic 13.7% |
| Cree | 0.8 /100 | #246 | Tragic 13.7% |