Serbian vs Immigrants from Zaire Single Mother Poverty
COMPARE
Serbian
Immigrants from Zaire
Single Mother Poverty
Single Mother Poverty Comparison
Serbians
Immigrants from Zaire
28.6%
SINGLE MOTHER POVERTY
85.0/ 100
METRIC RATING
149th/ 347
METRIC RANK
32.0%
SINGLE MOTHER POVERTY
0.0/ 100
METRIC RATING
278th/ 347
METRIC RANK
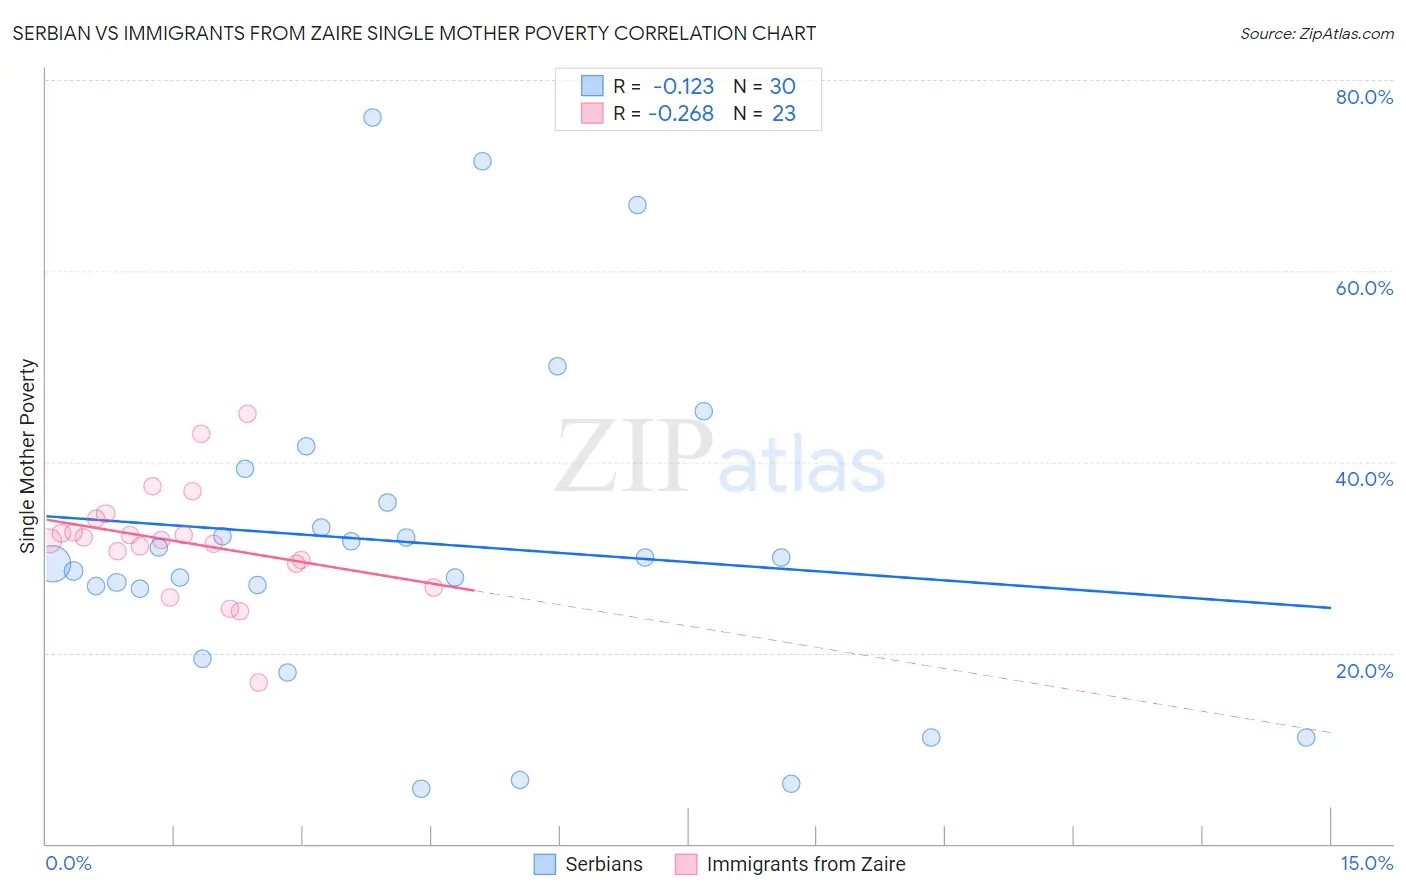
Serbian vs Immigrants from Zaire Single Mother Poverty Correlation Chart
The statistical analysis conducted on geographies consisting of 262,198,183 people shows a poor negative correlation between the proportion of Serbians and poverty level among single mothers in the United States with a correlation coefficient (R) of -0.123 and weighted average of 28.6%. Similarly, the statistical analysis conducted on geographies consisting of 106,703,532 people shows a weak negative correlation between the proportion of Immigrants from Zaire and poverty level among single mothers in the United States with a correlation coefficient (R) of -0.268 and weighted average of 32.0%, a difference of 11.9%.
Single Mother Poverty Correlation Summary
| Measurement | Serbian | Immigrants from Zaire |
| Minimum | 5.8% | 16.9% |
| Maximum | 76.1% | 45.1% |
| Range | 70.4% | 28.2% |
| Mean | 31.6% | 31.6% |
| Median | 29.6% | 31.9% |
| Interquartile 25% (IQ1) | 26.8% | 29.4% |
| Interquartile 75% (IQ3) | 35.8% | 34.1% |
| Interquartile Range (IQR) | 9.0% | 4.7% |
| Standard Deviation (Sample) | 17.4% | 5.9% |
| Standard Deviation (Population) | 17.1% | 5.8% |
Similar Demographics by Single Mother Poverty
Demographics Similar to Serbians by Single Mother Poverty
In terms of single mother poverty, the demographic groups most similar to Serbians are Syrian (28.6%, a difference of 0.020%), Immigrants from Lebanon (28.6%, a difference of 0.030%), Immigrants from Denmark (28.5%, a difference of 0.10%), Immigrants from South America (28.5%, a difference of 0.11%), and Luxembourger (28.5%, a difference of 0.14%).
| Demographics | Rating | Rank | Single Mother Poverty |
| South Africans | 86.6 /100 | #142 | Excellent 28.5% |
| Immigrants | North America | 86.5 /100 | #143 | Excellent 28.5% |
| Luxembourgers | 86.4 /100 | #144 | Excellent 28.5% |
| Immigrants | South America | 86.1 /100 | #145 | Excellent 28.5% |
| Immigrants | Denmark | 86.1 /100 | #146 | Excellent 28.5% |
| Immigrants | Lebanon | 85.3 /100 | #147 | Excellent 28.6% |
| Syrians | 85.3 /100 | #148 | Excellent 28.6% |
| Serbians | 85.0 /100 | #149 | Excellent 28.6% |
| Northern Europeans | 81.7 /100 | #150 | Excellent 28.6% |
| Immigrants | Oceania | 79.9 /100 | #151 | Good 28.7% |
| Austrians | 79.0 /100 | #152 | Good 28.7% |
| Slovenes | 76.4 /100 | #153 | Good 28.8% |
| Portuguese | 73.2 /100 | #154 | Good 28.8% |
| Ugandans | 71.7 /100 | #155 | Good 28.8% |
| Iraqis | 71.5 /100 | #156 | Good 28.8% |
Demographics Similar to Immigrants from Zaire by Single Mother Poverty
In terms of single mother poverty, the demographic groups most similar to Immigrants from Zaire are Mexican American Indian (31.9%, a difference of 0.22%), Marshallese (32.1%, a difference of 0.40%), Delaware (31.8%, a difference of 0.43%), Central American (31.8%, a difference of 0.60%), and Nonimmigrants (32.2%, a difference of 0.62%).
| Demographics | Rating | Rank | Single Mother Poverty |
| Immigrants | Cabo Verde | 0.1 /100 | #271 | Tragic 31.6% |
| Immigrants | Micronesia | 0.1 /100 | #272 | Tragic 31.6% |
| Fijians | 0.1 /100 | #273 | Tragic 31.6% |
| Bangladeshis | 0.1 /100 | #274 | Tragic 31.7% |
| Central Americans | 0.1 /100 | #275 | Tragic 31.8% |
| Delaware | 0.0 /100 | #276 | Tragic 31.8% |
| Mexican American Indians | 0.0 /100 | #277 | Tragic 31.9% |
| Immigrants | Zaire | 0.0 /100 | #278 | Tragic 32.0% |
| Marshallese | 0.0 /100 | #279 | Tragic 32.1% |
| Immigrants | Nonimmigrants | 0.0 /100 | #280 | Tragic 32.2% |
| Cree | 0.0 /100 | #281 | Tragic 32.2% |
| Immigrants | Azores | 0.0 /100 | #282 | Tragic 32.2% |
| Spanish Americans | 0.0 /100 | #283 | Tragic 32.3% |
| Indonesians | 0.0 /100 | #284 | Tragic 32.4% |
| Immigrants | Latin America | 0.0 /100 | #285 | Tragic 32.4% |