Immigrants from Malaysia vs Immigrants from Moldova Single Mother Poverty
COMPARE
Immigrants from Malaysia
Immigrants from Moldova
Single Mother Poverty
Single Mother Poverty Comparison
Immigrants from Malaysia
Immigrants from Moldova
27.3%
SINGLE MOTHER POVERTY
99.5/ 100
METRIC RATING
62nd/ 347
METRIC RANK
26.2%
SINGLE MOTHER POVERTY
100.0/ 100
METRIC RATING
24th/ 347
METRIC RANK
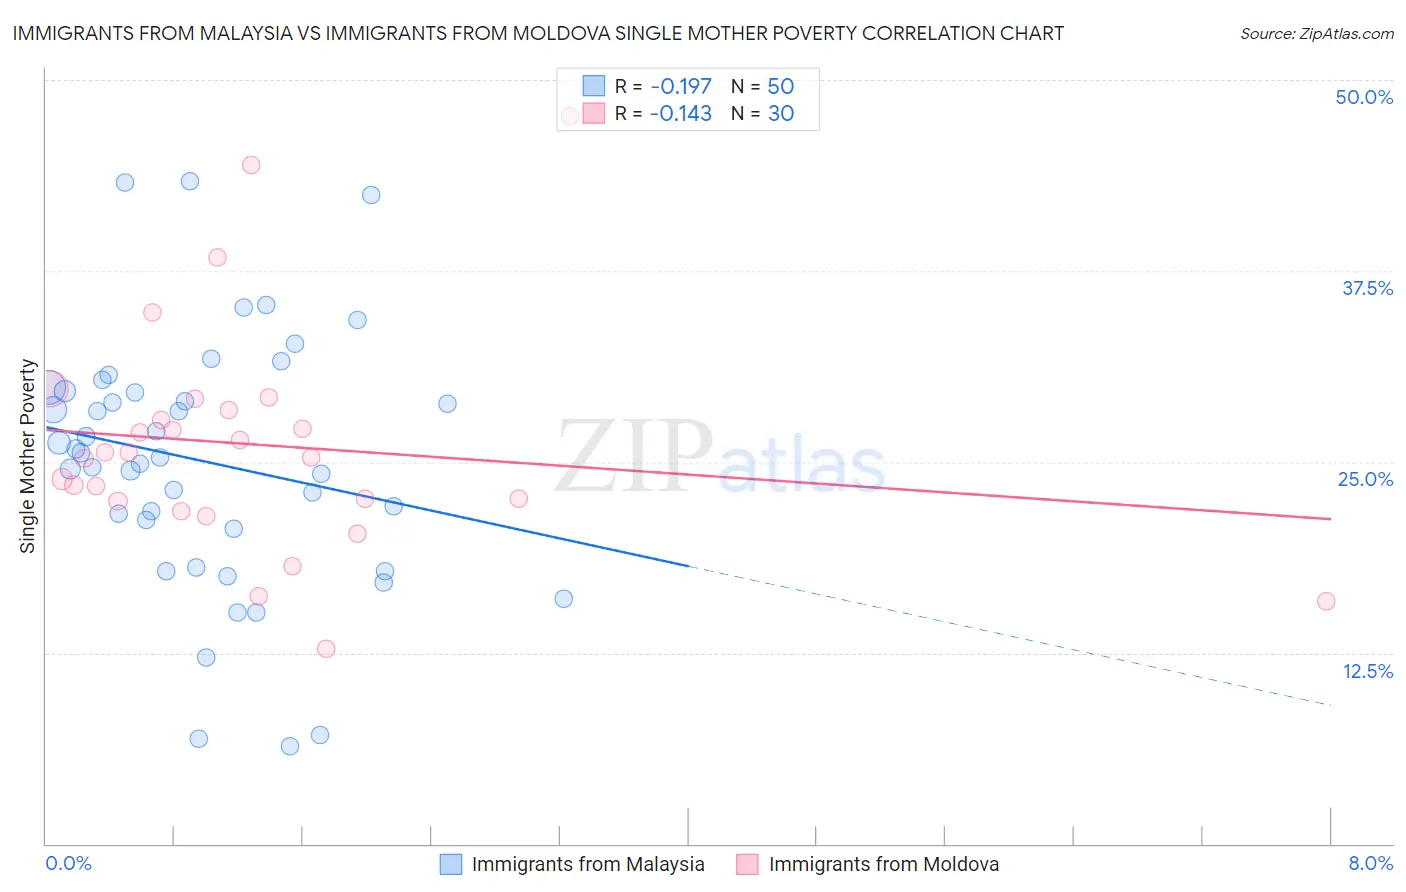
Immigrants from Malaysia vs Immigrants from Moldova Single Mother Poverty Correlation Chart
The statistical analysis conducted on geographies consisting of 194,970,165 people shows a poor negative correlation between the proportion of Immigrants from Malaysia and poverty level among single mothers in the United States with a correlation coefficient (R) of -0.197 and weighted average of 27.3%. Similarly, the statistical analysis conducted on geographies consisting of 123,037,765 people shows a poor negative correlation between the proportion of Immigrants from Moldova and poverty level among single mothers in the United States with a correlation coefficient (R) of -0.143 and weighted average of 26.2%, a difference of 3.9%.
Single Mother Poverty Correlation Summary
| Measurement | Immigrants from Malaysia | Immigrants from Moldova |
| Minimum | 6.4% | 12.8% |
| Maximum | 43.4% | 47.6% |
| Range | 37.0% | 34.8% |
| Mean | 25.0% | 26.1% |
| Median | 25.4% | 25.4% |
| Interquartile 25% (IQ1) | 20.7% | 22.4% |
| Interquartile 75% (IQ3) | 29.6% | 28.4% |
| Interquartile Range (IQR) | 9.0% | 5.9% |
| Standard Deviation (Sample) | 8.3% | 7.5% |
| Standard Deviation (Population) | 8.3% | 7.4% |
Similar Demographics by Single Mother Poverty
Demographics Similar to Immigrants from Malaysia by Single Mother Poverty
In terms of single mother poverty, the demographic groups most similar to Immigrants from Malaysia are Immigrants from Northern Europe (27.3%, a difference of 0.050%), Russian (27.3%, a difference of 0.080%), Immigrants from Eastern Europe (27.2%, a difference of 0.14%), Immigrants from Turkey (27.3%, a difference of 0.16%), and Soviet Union (27.3%, a difference of 0.19%).
| Demographics | Rating | Rank | Single Mother Poverty |
| Immigrants | Egypt | 99.7 /100 | #55 | Exceptional 27.1% |
| Immigrants | Romania | 99.7 /100 | #56 | Exceptional 27.2% |
| Palestinians | 99.7 /100 | #57 | Exceptional 27.2% |
| Argentineans | 99.6 /100 | #58 | Exceptional 27.2% |
| Paraguayans | 99.6 /100 | #59 | Exceptional 27.2% |
| Eastern Europeans | 99.6 /100 | #60 | Exceptional 27.2% |
| Immigrants | Eastern Europe | 99.6 /100 | #61 | Exceptional 27.2% |
| Immigrants | Malaysia | 99.5 /100 | #62 | Exceptional 27.3% |
| Immigrants | Northern Europe | 99.5 /100 | #63 | Exceptional 27.3% |
| Russians | 99.5 /100 | #64 | Exceptional 27.3% |
| Immigrants | Turkey | 99.5 /100 | #65 | Exceptional 27.3% |
| Soviet Union | 99.5 /100 | #66 | Exceptional 27.3% |
| Immigrants | Australia | 99.5 /100 | #67 | Exceptional 27.3% |
| Immigrants | Czechoslovakia | 99.5 /100 | #68 | Exceptional 27.4% |
| Lithuanians | 99.4 /100 | #69 | Exceptional 27.4% |
Demographics Similar to Immigrants from Moldova by Single Mother Poverty
In terms of single mother poverty, the demographic groups most similar to Immigrants from Moldova are Burmese (26.2%, a difference of 0.020%), Immigrants from Asia (26.3%, a difference of 0.19%), Immigrants from Korea (26.2%, a difference of 0.20%), Immigrants from Sri Lanka (26.3%, a difference of 0.32%), and Immigrants from Bolivia (26.2%, a difference of 0.37%).
| Demographics | Rating | Rank | Single Mother Poverty |
| Asians | 100.0 /100 | #17 | Exceptional 26.0% |
| Immigrants | Pakistan | 100.0 /100 | #18 | Exceptional 26.0% |
| Immigrants | Eastern Asia | 100.0 /100 | #19 | Exceptional 26.1% |
| Immigrants | China | 100.0 /100 | #20 | Exceptional 26.1% |
| Immigrants | Bolivia | 100.0 /100 | #21 | Exceptional 26.2% |
| Immigrants | Korea | 100.0 /100 | #22 | Exceptional 26.2% |
| Burmese | 100.0 /100 | #23 | Exceptional 26.2% |
| Immigrants | Moldova | 100.0 /100 | #24 | Exceptional 26.2% |
| Immigrants | Asia | 100.0 /100 | #25 | Exceptional 26.3% |
| Immigrants | Sri Lanka | 100.0 /100 | #26 | Exceptional 26.3% |
| Immigrants | Japan | 100.0 /100 | #27 | Exceptional 26.4% |
| Koreans | 100.0 /100 | #28 | Exceptional 26.4% |
| Jordanians | 100.0 /100 | #29 | Exceptional 26.4% |
| Turks | 100.0 /100 | #30 | Exceptional 26.4% |
| Immigrants | Philippines | 100.0 /100 | #31 | Exceptional 26.5% |