Senegalese vs Immigrants from Moldova Disability Age Under 5
COMPARE
Senegalese
Immigrants from Moldova
Disability Age Under 5
Disability Age Under 5 Comparison
Senegalese
Immigrants from Moldova
1.2%
DISABILITY AGE UNDER 5
94.6/ 100
METRIC RATING
111th/ 347
METRIC RANK
1.1%
DISABILITY AGE UNDER 5
96.8/ 100
METRIC RATING
95th/ 347
METRIC RANK
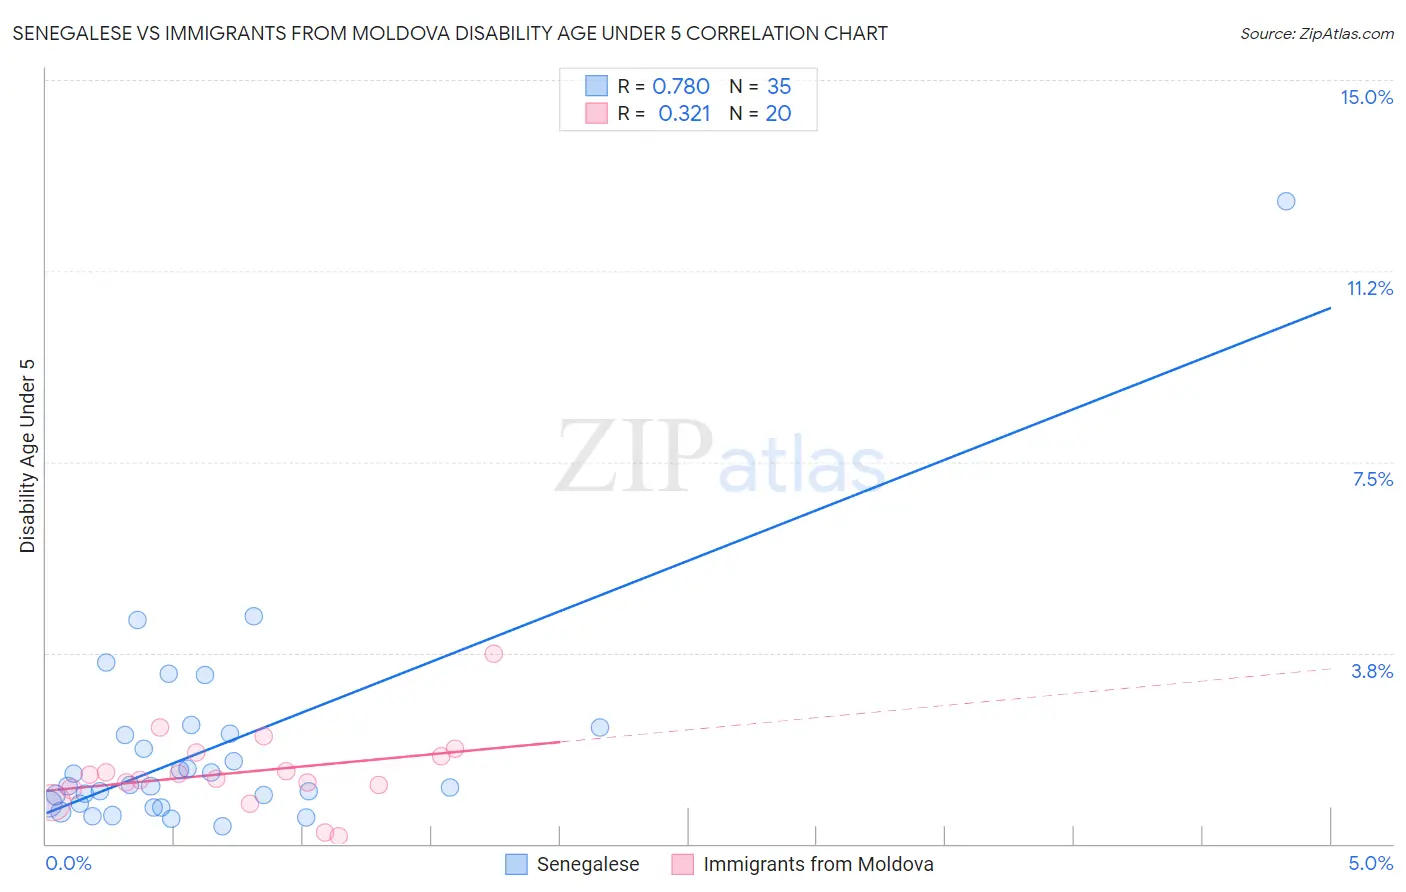
Senegalese vs Immigrants from Moldova Disability Age Under 5 Correlation Chart
The statistical analysis conducted on geographies consisting of 62,306,904 people shows a strong positive correlation between the proportion of Senegalese and percentage of population with a disability under the age of 5 in the United States with a correlation coefficient (R) of 0.780 and weighted average of 1.2%. Similarly, the statistical analysis conducted on geographies consisting of 88,816,891 people shows a mild positive correlation between the proportion of Immigrants from Moldova and percentage of population with a disability under the age of 5 in the United States with a correlation coefficient (R) of 0.321 and weighted average of 1.1%, a difference of 1.3%.
Disability Age Under 5 Correlation Summary
| Measurement | Senegalese | Immigrants from Moldova |
| Minimum | 0.35% | 0.14% |
| Maximum | 12.6% | 3.7% |
| Range | 12.3% | 3.6% |
| Mean | 1.9% | 1.4% |
| Median | 1.1% | 1.3% |
| Interquartile 25% (IQ1) | 0.77% | 1.1% |
| Interquartile 75% (IQ3) | 2.2% | 1.8% |
| Interquartile Range (IQR) | 1.4% | 0.63% |
| Standard Deviation (Sample) | 2.2% | 0.77% |
| Standard Deviation (Population) | 2.1% | 0.75% |
Demographics Similar to Senegalese and Immigrants from Moldova by Disability Age Under 5
In terms of disability age under 5, the demographic groups most similar to Senegalese are Immigrants from Australia (1.2%, a difference of 0.11%), Immigrants from Oceania (1.2%, a difference of 0.17%), Immigrants from Lebanon (1.2%, a difference of 0.20%), Immigrants from Panama (1.2%, a difference of 0.22%), and Iraqi (1.2%, a difference of 0.24%). Similarly, the demographic groups most similar to Immigrants from Moldova are Sri Lankan (1.1%, a difference of 0.050%), Mongolian (1.1%, a difference of 0.10%), Spanish American (1.1%, a difference of 0.11%), Immigrants from Iraq (1.1%, a difference of 0.20%), and Immigrants from South Eastern Asia (1.1%, a difference of 0.22%).
| Demographics | Rating | Rank | Disability Age Under 5 |
| Spanish Americans | 96.9 /100 | #93 | Exceptional 1.1% |
| Sri Lankans | 96.8 /100 | #94 | Exceptional 1.1% |
| Immigrants | Moldova | 96.8 /100 | #95 | Exceptional 1.1% |
| Mongolians | 96.6 /100 | #96 | Exceptional 1.1% |
| Immigrants | Iraq | 96.5 /100 | #97 | Exceptional 1.1% |
| Immigrants | South Eastern Asia | 96.5 /100 | #98 | Exceptional 1.1% |
| Dominicans | 96.3 /100 | #99 | Exceptional 1.1% |
| Nicaraguans | 96.3 /100 | #100 | Exceptional 1.1% |
| Immigrants | Uganda | 96.1 /100 | #101 | Exceptional 1.1% |
| Immigrants | Morocco | 96.0 /100 | #102 | Exceptional 1.2% |
| Immigrants | Nicaragua | 96.0 /100 | #103 | Exceptional 1.2% |
| Indonesians | 95.9 /100 | #104 | Exceptional 1.2% |
| Immigrants | South Africa | 95.6 /100 | #105 | Exceptional 1.2% |
| Cambodians | 95.4 /100 | #106 | Exceptional 1.2% |
| Immigrants | West Indies | 95.3 /100 | #107 | Exceptional 1.2% |
| Iraqis | 95.1 /100 | #108 | Exceptional 1.2% |
| Immigrants | Panama | 95.0 /100 | #109 | Exceptional 1.2% |
| Immigrants | Lebanon | 95.0 /100 | #110 | Exceptional 1.2% |
| Senegalese | 94.6 /100 | #111 | Exceptional 1.2% |
| Immigrants | Australia | 94.4 /100 | #112 | Exceptional 1.2% |
| Immigrants | Oceania | 94.2 /100 | #113 | Exceptional 1.2% |