Immigrants from Indonesia vs Immigrants from Moldova Single Mother Poverty
COMPARE
Immigrants from Indonesia
Immigrants from Moldova
Single Mother Poverty
Single Mother Poverty Comparison
Immigrants from Indonesia
Immigrants from Moldova
26.6%
SINGLE MOTHER POVERTY
99.9/ 100
METRIC RATING
34th/ 347
METRIC RANK
26.2%
SINGLE MOTHER POVERTY
100.0/ 100
METRIC RATING
24th/ 347
METRIC RANK
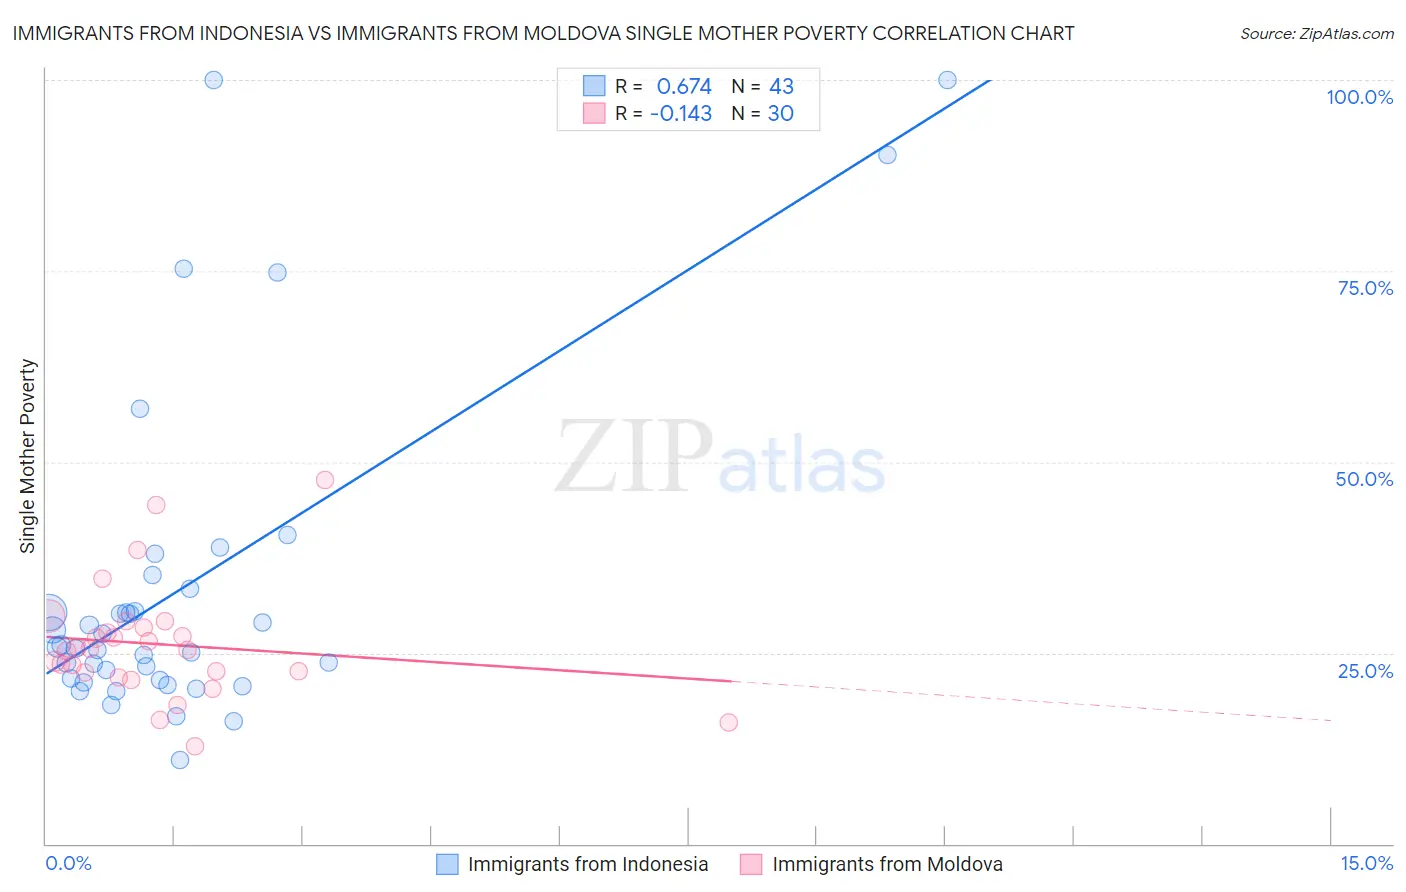
Immigrants from Indonesia vs Immigrants from Moldova Single Mother Poverty Correlation Chart
The statistical analysis conducted on geographies consisting of 212,668,546 people shows a significant positive correlation between the proportion of Immigrants from Indonesia and poverty level among single mothers in the United States with a correlation coefficient (R) of 0.674 and weighted average of 26.6%. Similarly, the statistical analysis conducted on geographies consisting of 123,037,765 people shows a poor negative correlation between the proportion of Immigrants from Moldova and poverty level among single mothers in the United States with a correlation coefficient (R) of -0.143 and weighted average of 26.2%, a difference of 1.2%.
Single Mother Poverty Correlation Summary
| Measurement | Immigrants from Indonesia | Immigrants from Moldova |
| Minimum | 11.0% | 12.8% |
| Maximum | 100.0% | 47.6% |
| Range | 89.0% | 34.8% |
| Mean | 33.6% | 26.1% |
| Median | 25.7% | 25.4% |
| Interquartile 25% (IQ1) | 21.5% | 22.4% |
| Interquartile 75% (IQ3) | 33.4% | 28.4% |
| Interquartile Range (IQR) | 11.9% | 5.9% |
| Standard Deviation (Sample) | 21.7% | 7.5% |
| Standard Deviation (Population) | 21.5% | 7.4% |
Demographics Similar to Immigrants from Indonesia and Immigrants from Moldova by Single Mother Poverty
In terms of single mother poverty, the demographic groups most similar to Immigrants from Indonesia are Bulgarian (26.5%, a difference of 0.010%), Tongan (26.5%, a difference of 0.050%), Maltese (26.6%, a difference of 0.12%), Okinawan (26.6%, a difference of 0.17%), and Immigrants from Israel (26.6%, a difference of 0.17%). Similarly, the demographic groups most similar to Immigrants from Moldova are Burmese (26.2%, a difference of 0.020%), Immigrants from Asia (26.3%, a difference of 0.19%), Immigrants from Korea (26.2%, a difference of 0.20%), Immigrants from Sri Lanka (26.3%, a difference of 0.32%), and Immigrants from Bolivia (26.2%, a difference of 0.37%).
| Demographics | Rating | Rank | Single Mother Poverty |
| Immigrants | Eastern Asia | 100.0 /100 | #19 | Exceptional 26.1% |
| Immigrants | China | 100.0 /100 | #20 | Exceptional 26.1% |
| Immigrants | Bolivia | 100.0 /100 | #21 | Exceptional 26.2% |
| Immigrants | Korea | 100.0 /100 | #22 | Exceptional 26.2% |
| Burmese | 100.0 /100 | #23 | Exceptional 26.2% |
| Immigrants | Moldova | 100.0 /100 | #24 | Exceptional 26.2% |
| Immigrants | Asia | 100.0 /100 | #25 | Exceptional 26.3% |
| Immigrants | Sri Lanka | 100.0 /100 | #26 | Exceptional 26.3% |
| Immigrants | Japan | 100.0 /100 | #27 | Exceptional 26.4% |
| Koreans | 100.0 /100 | #28 | Exceptional 26.4% |
| Jordanians | 100.0 /100 | #29 | Exceptional 26.4% |
| Turks | 100.0 /100 | #30 | Exceptional 26.4% |
| Immigrants | Philippines | 100.0 /100 | #31 | Exceptional 26.5% |
| Tongans | 99.9 /100 | #32 | Exceptional 26.5% |
| Bulgarians | 99.9 /100 | #33 | Exceptional 26.5% |
| Immigrants | Indonesia | 99.9 /100 | #34 | Exceptional 26.6% |
| Maltese | 99.9 /100 | #35 | Exceptional 26.6% |
| Okinawans | 99.9 /100 | #36 | Exceptional 26.6% |
| Immigrants | Israel | 99.9 /100 | #37 | Exceptional 26.6% |
| Immigrants | Fiji | 99.9 /100 | #38 | Exceptional 26.6% |
| Sri Lankans | 99.9 /100 | #39 | Exceptional 26.7% |