German vs Immigrants from Moldova Single Mother Poverty
COMPARE
German
Immigrants from Moldova
Single Mother Poverty
Single Mother Poverty Comparison
Germans
Immigrants from Moldova
30.0%
SINGLE MOTHER POVERTY
8.8/ 100
METRIC RATING
220th/ 347
METRIC RANK
26.2%
SINGLE MOTHER POVERTY
100.0/ 100
METRIC RATING
24th/ 347
METRIC RANK
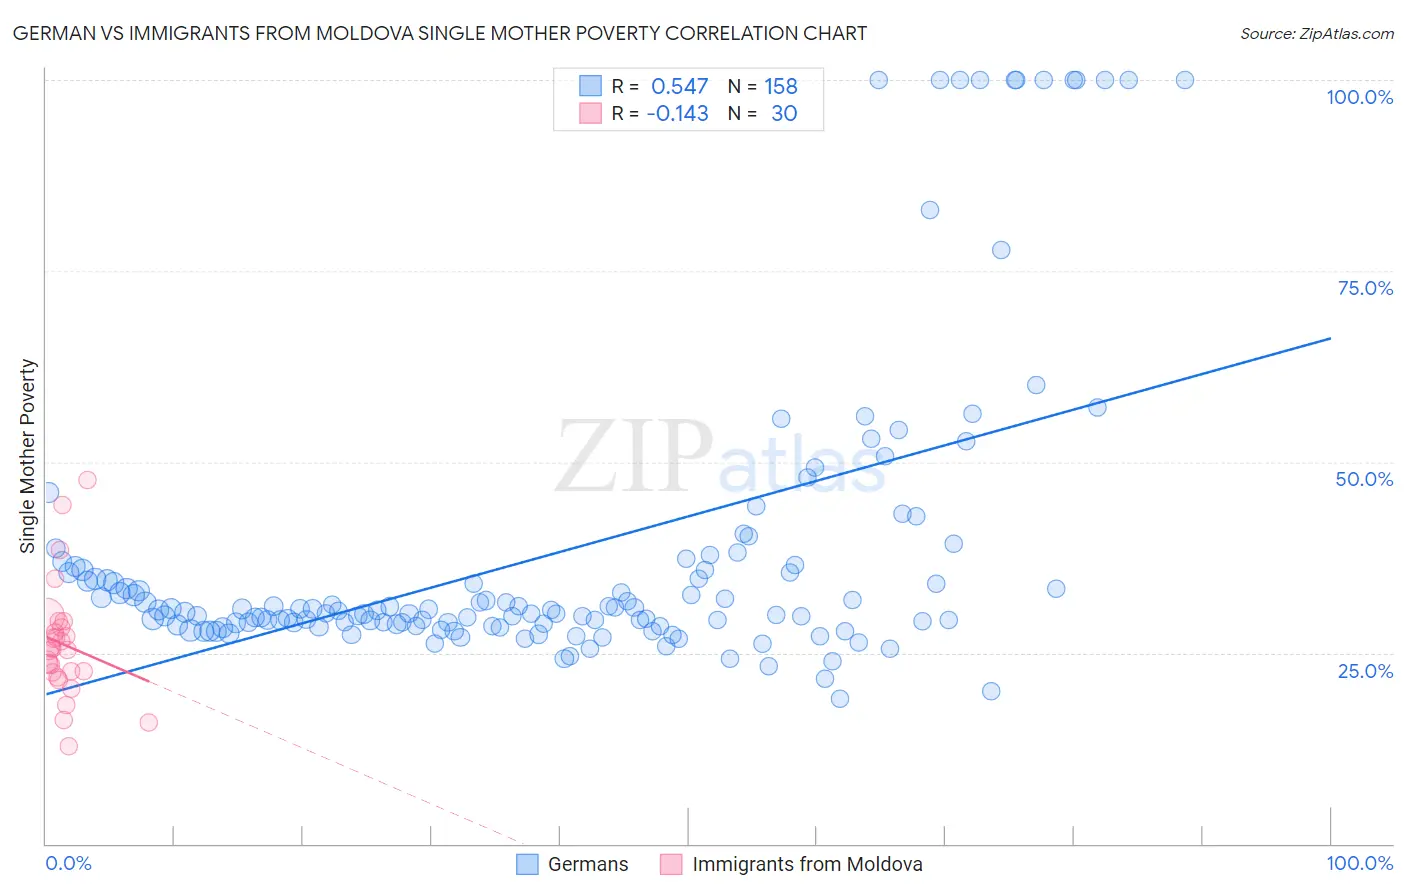
German vs Immigrants from Moldova Single Mother Poverty Correlation Chart
The statistical analysis conducted on geographies consisting of 549,975,731 people shows a substantial positive correlation between the proportion of Germans and poverty level among single mothers in the United States with a correlation coefficient (R) of 0.547 and weighted average of 30.0%. Similarly, the statistical analysis conducted on geographies consisting of 123,037,765 people shows a poor negative correlation between the proportion of Immigrants from Moldova and poverty level among single mothers in the United States with a correlation coefficient (R) of -0.143 and weighted average of 26.2%, a difference of 14.2%.
Single Mother Poverty Correlation Summary
| Measurement | German | Immigrants from Moldova |
| Minimum | 18.9% | 12.8% |
| Maximum | 100.0% | 47.6% |
| Range | 81.1% | 34.8% |
| Mean | 38.1% | 26.1% |
| Median | 30.6% | 25.4% |
| Interquartile 25% (IQ1) | 28.8% | 22.4% |
| Interquartile 75% (IQ3) | 35.8% | 28.4% |
| Interquartile Range (IQR) | 7.1% | 5.9% |
| Standard Deviation (Sample) | 19.9% | 7.5% |
| Standard Deviation (Population) | 19.9% | 7.4% |
Similar Demographics by Single Mother Poverty
Demographics Similar to Germans by Single Mother Poverty
In terms of single mother poverty, the demographic groups most similar to Germans are Finnish (30.0%, a difference of 0.070%), Immigrants from Eritrea (30.0%, a difference of 0.17%), Sudanese (30.0%, a difference of 0.18%), Hungarian (29.9%, a difference of 0.21%), and Immigrants from Cuba (30.1%, a difference of 0.31%).
| Demographics | Rating | Rank | Single Mother Poverty |
| Immigrants | Thailand | 12.0 /100 | #213 | Poor 29.9% |
| Liberians | 11.7 /100 | #214 | Poor 29.9% |
| Jamaicans | 11.7 /100 | #215 | Poor 29.9% |
| Immigrants | Western Africa | 11.5 /100 | #216 | Poor 29.9% |
| Immigrants | Ghana | 11.3 /100 | #217 | Poor 29.9% |
| Hungarians | 10.3 /100 | #218 | Poor 29.9% |
| Finns | 9.3 /100 | #219 | Tragic 30.0% |
| Germans | 8.8 /100 | #220 | Tragic 30.0% |
| Immigrants | Eritrea | 7.7 /100 | #221 | Tragic 30.0% |
| Sudanese | 7.6 /100 | #222 | Tragic 30.0% |
| Immigrants | Cuba | 6.9 /100 | #223 | Tragic 30.1% |
| Immigrants | Sudan | 6.5 /100 | #224 | Tragic 30.1% |
| Spanish | 6.3 /100 | #225 | Tragic 30.1% |
| Scottish | 6.0 /100 | #226 | Tragic 30.1% |
| Immigrants | Liberia | 5.9 /100 | #227 | Tragic 30.1% |
Demographics Similar to Immigrants from Moldova by Single Mother Poverty
In terms of single mother poverty, the demographic groups most similar to Immigrants from Moldova are Burmese (26.2%, a difference of 0.020%), Immigrants from Asia (26.3%, a difference of 0.19%), Immigrants from Korea (26.2%, a difference of 0.20%), Immigrants from Sri Lanka (26.3%, a difference of 0.32%), and Immigrants from Bolivia (26.2%, a difference of 0.37%).
| Demographics | Rating | Rank | Single Mother Poverty |
| Asians | 100.0 /100 | #17 | Exceptional 26.0% |
| Immigrants | Pakistan | 100.0 /100 | #18 | Exceptional 26.0% |
| Immigrants | Eastern Asia | 100.0 /100 | #19 | Exceptional 26.1% |
| Immigrants | China | 100.0 /100 | #20 | Exceptional 26.1% |
| Immigrants | Bolivia | 100.0 /100 | #21 | Exceptional 26.2% |
| Immigrants | Korea | 100.0 /100 | #22 | Exceptional 26.2% |
| Burmese | 100.0 /100 | #23 | Exceptional 26.2% |
| Immigrants | Moldova | 100.0 /100 | #24 | Exceptional 26.2% |
| Immigrants | Asia | 100.0 /100 | #25 | Exceptional 26.3% |
| Immigrants | Sri Lanka | 100.0 /100 | #26 | Exceptional 26.3% |
| Immigrants | Japan | 100.0 /100 | #27 | Exceptional 26.4% |
| Koreans | 100.0 /100 | #28 | Exceptional 26.4% |
| Jordanians | 100.0 /100 | #29 | Exceptional 26.4% |
| Turks | 100.0 /100 | #30 | Exceptional 26.4% |
| Immigrants | Philippines | 100.0 /100 | #31 | Exceptional 26.5% |