Seminole vs European Poverty
COMPARE
Seminole
European
Poverty
Poverty Comparison
Seminole
Europeans
15.6%
POVERTY
0.0/ 100
METRIC RATING
309th/ 347
METRIC RANK
11.3%
POVERTY
97.2/ 100
METRIC RATING
72nd/ 347
METRIC RANK
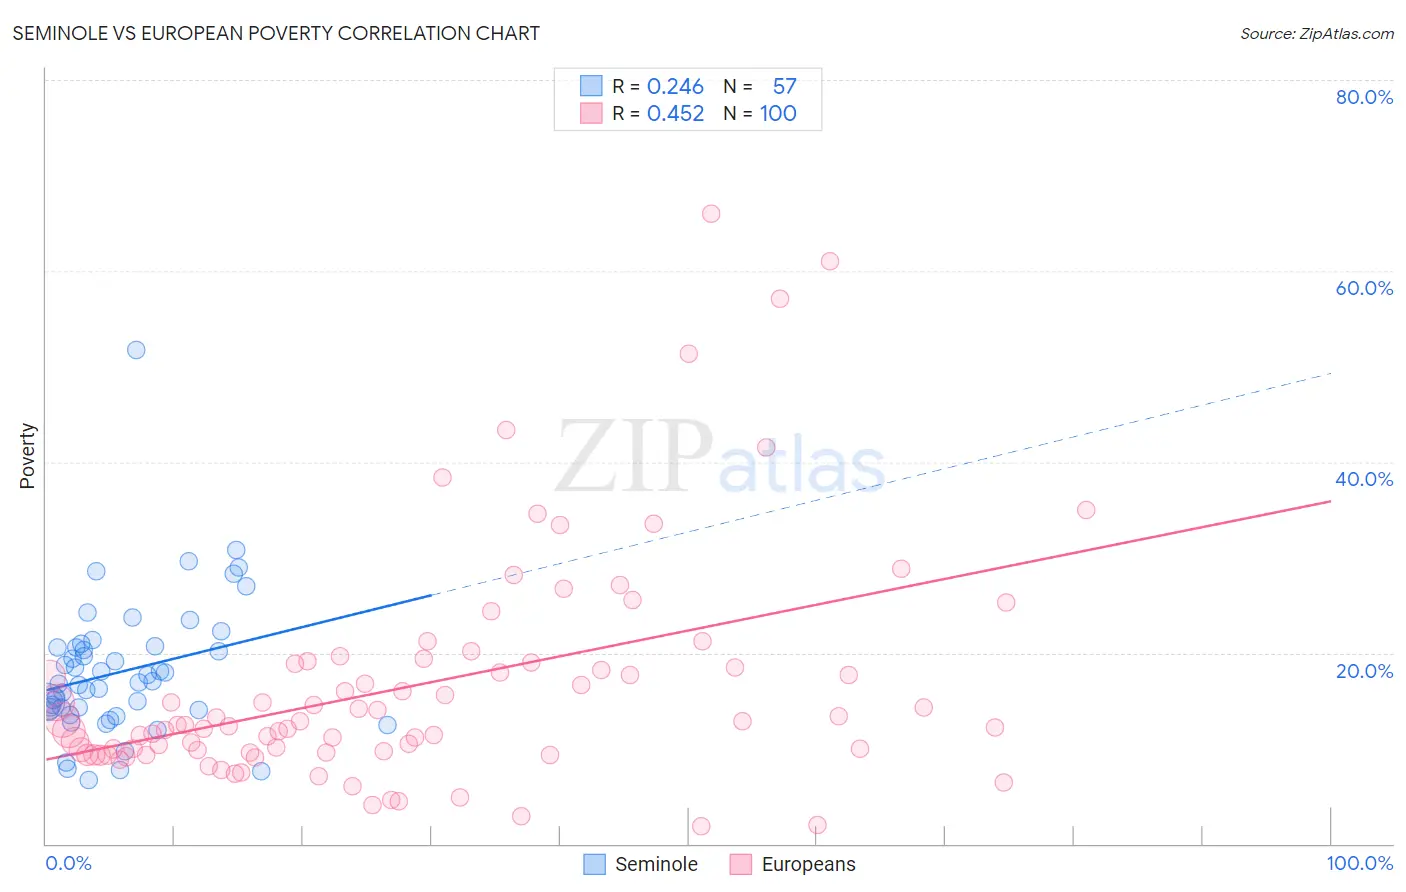
Seminole vs European Poverty Correlation Chart
The statistical analysis conducted on geographies consisting of 118,300,623 people shows a weak positive correlation between the proportion of Seminole and poverty level in the United States with a correlation coefficient (R) of 0.246 and weighted average of 15.6%. Similarly, the statistical analysis conducted on geographies consisting of 561,084,315 people shows a moderate positive correlation between the proportion of Europeans and poverty level in the United States with a correlation coefficient (R) of 0.452 and weighted average of 11.3%, a difference of 38.7%.
Poverty Correlation Summary
| Measurement | Seminole | European |
| Minimum | 6.7% | 1.9% |
| Maximum | 51.8% | 66.0% |
| Range | 45.1% | 64.1% |
| Mean | 18.0% | 16.6% |
| Median | 16.9% | 12.4% |
| Interquartile 25% (IQ1) | 13.9% | 9.6% |
| Interquartile 75% (IQ3) | 20.7% | 19.0% |
| Interquartile Range (IQR) | 6.8% | 9.3% |
| Standard Deviation (Sample) | 7.3% | 12.1% |
| Standard Deviation (Population) | 7.2% | 12.0% |
Similar Demographics by Poverty
Demographics Similar to Seminole by Poverty
In terms of poverty, the demographic groups most similar to Seminole are Choctaw (15.6%, a difference of 0.040%), Dutch West Indian (15.6%, a difference of 0.090%), African (15.6%, a difference of 0.15%), Creek (15.6%, a difference of 0.23%), and Chippewa (15.7%, a difference of 0.48%).
| Demographics | Rating | Rank | Poverty |
| Somalis | 0.0 /100 | #302 | Tragic 15.4% |
| Immigrants | Caribbean | 0.0 /100 | #303 | Tragic 15.5% |
| Immigrants | Mexico | 0.0 /100 | #304 | Tragic 15.5% |
| Immigrants | Guatemala | 0.0 /100 | #305 | Tragic 15.5% |
| Creek | 0.0 /100 | #306 | Tragic 15.6% |
| Africans | 0.0 /100 | #307 | Tragic 15.6% |
| Choctaw | 0.0 /100 | #308 | Tragic 15.6% |
| Seminole | 0.0 /100 | #309 | Tragic 15.6% |
| Dutch West Indians | 0.0 /100 | #310 | Tragic 15.6% |
| Chippewa | 0.0 /100 | #311 | Tragic 15.7% |
| Cajuns | 0.0 /100 | #312 | Tragic 15.7% |
| Immigrants | Grenada | 0.0 /100 | #313 | Tragic 15.8% |
| Immigrants | Somalia | 0.0 /100 | #314 | Tragic 15.8% |
| British West Indians | 0.0 /100 | #315 | Tragic 15.9% |
| Hondurans | 0.0 /100 | #316 | Tragic 15.9% |
Demographics Similar to Europeans by Poverty
In terms of poverty, the demographic groups most similar to Europeans are Immigrants from Belgium (11.3%, a difference of 0.0%), Zimbabwean (11.3%, a difference of 0.020%), Immigrants from Canada (11.3%, a difference of 0.040%), Carpatho Rusyn (11.3%, a difference of 0.050%), and Serbian (11.2%, a difference of 0.13%).
| Demographics | Rating | Rank | Poverty |
| Immigrants | Asia | 97.5 /100 | #65 | Exceptional 11.2% |
| Immigrants | Netherlands | 97.5 /100 | #66 | Exceptional 11.2% |
| Immigrants | Australia | 97.4 /100 | #67 | Exceptional 11.2% |
| Slovaks | 97.4 /100 | #68 | Exceptional 11.2% |
| Serbians | 97.4 /100 | #69 | Exceptional 11.2% |
| Immigrants | Canada | 97.3 /100 | #70 | Exceptional 11.3% |
| Zimbabweans | 97.3 /100 | #71 | Exceptional 11.3% |
| Europeans | 97.2 /100 | #72 | Exceptional 11.3% |
| Immigrants | Belgium | 97.2 /100 | #73 | Exceptional 11.3% |
| Carpatho Rusyns | 97.2 /100 | #74 | Exceptional 11.3% |
| Immigrants | Eastern Europe | 97.0 /100 | #75 | Exceptional 11.3% |
| Immigrants | North America | 96.8 /100 | #76 | Exceptional 11.3% |
| Immigrants | Eastern Asia | 96.7 /100 | #77 | Exceptional 11.3% |
| Dutch | 96.7 /100 | #78 | Exceptional 11.3% |
| Cambodians | 96.7 /100 | #79 | Exceptional 11.3% |