Scottish vs American Male Poverty
COMPARE
Scottish
American
Male Poverty
Male Poverty Comparison
Scottish
Americans
10.4%
MALE POVERTY
94.0/ 100
METRIC RATING
95th/ 347
METRIC RANK
12.1%
MALE POVERTY
3.2/ 100
METRIC RATING
212th/ 347
METRIC RANK
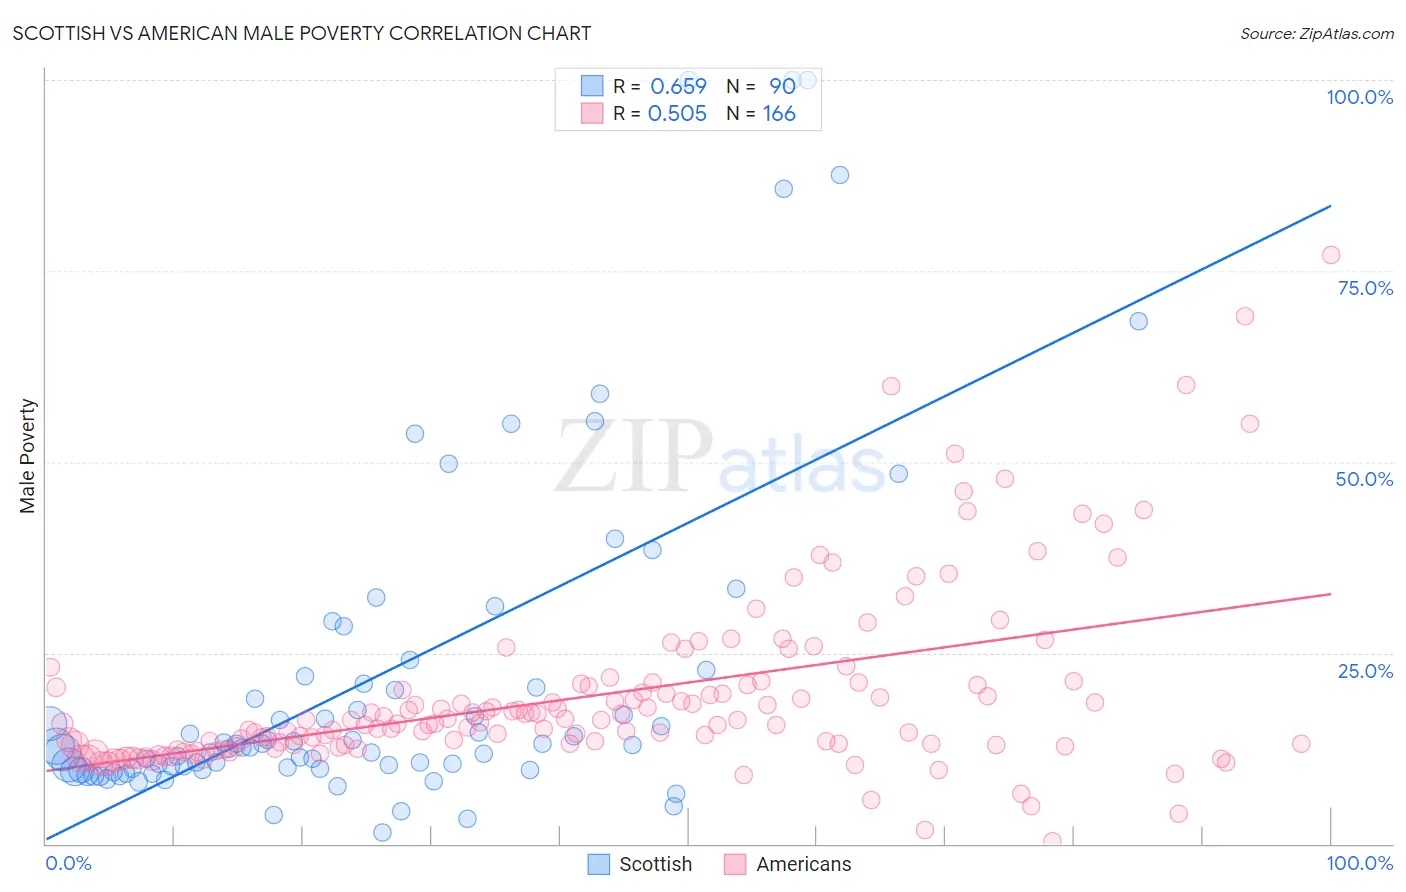
Scottish vs American Male Poverty Correlation Chart
The statistical analysis conducted on geographies consisting of 565,490,793 people shows a significant positive correlation between the proportion of Scottish and poverty level among males in the United States with a correlation coefficient (R) of 0.659 and weighted average of 10.4%. Similarly, the statistical analysis conducted on geographies consisting of 579,982,816 people shows a substantial positive correlation between the proportion of Americans and poverty level among males in the United States with a correlation coefficient (R) of 0.505 and weighted average of 12.1%, a difference of 16.2%.
Male Poverty Correlation Summary
| Measurement | Scottish | American |
| Minimum | 1.5% | 0.36% |
| Maximum | 100.0% | 77.0% |
| Range | 98.5% | 76.7% |
| Mean | 21.6% | 19.4% |
| Median | 12.7% | 15.8% |
| Interquartile 25% (IQ1) | 9.8% | 12.9% |
| Interquartile 75% (IQ3) | 20.9% | 20.8% |
| Interquartile Range (IQR) | 11.1% | 7.9% |
| Standard Deviation (Sample) | 22.3% | 11.9% |
| Standard Deviation (Population) | 22.2% | 11.8% |
Similar Demographics by Male Poverty
Demographics Similar to Scottish by Male Poverty
In terms of male poverty, the demographic groups most similar to Scottish are Immigrants from South Africa (10.4%, a difference of 0.030%), Immigrants from Egypt (10.4%, a difference of 0.13%), Romanian (10.5%, a difference of 0.18%), Australian (10.4%, a difference of 0.20%), and Jordanian (10.4%, a difference of 0.21%).
| Demographics | Rating | Rank | Male Poverty |
| Cambodians | 95.0 /100 | #88 | Exceptional 10.4% |
| Immigrants | Denmark | 95.0 /100 | #89 | Exceptional 10.4% |
| Indians (Asian) | 94.9 /100 | #90 | Exceptional 10.4% |
| British | 94.8 /100 | #91 | Exceptional 10.4% |
| Jordanians | 94.4 /100 | #92 | Exceptional 10.4% |
| Australians | 94.4 /100 | #93 | Exceptional 10.4% |
| Immigrants | South Africa | 94.1 /100 | #94 | Exceptional 10.4% |
| Scottish | 94.0 /100 | #95 | Exceptional 10.4% |
| Immigrants | Egypt | 93.7 /100 | #96 | Exceptional 10.4% |
| Romanians | 93.6 /100 | #97 | Exceptional 10.5% |
| Finns | 93.4 /100 | #98 | Exceptional 10.5% |
| Immigrants | Indonesia | 93.3 /100 | #99 | Exceptional 10.5% |
| Immigrants | Latvia | 92.8 /100 | #100 | Exceptional 10.5% |
| Immigrants | Zimbabwe | 92.0 /100 | #101 | Exceptional 10.5% |
| French Canadians | 91.9 /100 | #102 | Exceptional 10.5% |
Demographics Similar to Americans by Male Poverty
In terms of male poverty, the demographic groups most similar to Americans are Nonimmigrants (12.1%, a difference of 0.040%), Japanese (12.2%, a difference of 0.35%), Immigrants from Uzbekistan (12.2%, a difference of 0.47%), Immigrants from Cambodia (12.2%, a difference of 0.55%), and Immigrants from Panama (12.1%, a difference of 0.56%).
| Demographics | Rating | Rank | Male Poverty |
| Panamanians | 6.2 /100 | #205 | Tragic 11.9% |
| Immigrants | Eastern Africa | 5.4 /100 | #206 | Tragic 12.0% |
| Malaysians | 5.2 /100 | #207 | Tragic 12.0% |
| Immigrants | Immigrants | 4.5 /100 | #208 | Tragic 12.0% |
| Immigrants | Azores | 4.3 /100 | #209 | Tragic 12.0% |
| Moroccans | 4.2 /100 | #210 | Tragic 12.0% |
| Immigrants | Panama | 4.0 /100 | #211 | Tragic 12.1% |
| Americans | 3.2 /100 | #212 | Tragic 12.1% |
| Immigrants | Nonimmigrants | 3.1 /100 | #213 | Tragic 12.1% |
| Japanese | 2.7 /100 | #214 | Tragic 12.2% |
| Immigrants | Uzbekistan | 2.6 /100 | #215 | Tragic 12.2% |
| Immigrants | Cambodia | 2.5 /100 | #216 | Tragic 12.2% |
| Immigrants | Thailand | 2.5 /100 | #217 | Tragic 12.2% |
| German Russians | 2.5 /100 | #218 | Tragic 12.2% |
| Bermudans | 2.4 /100 | #219 | Tragic 12.2% |