Immigrants from Ghana vs Immigrants from Liberia Poverty
COMPARE
Immigrants from Ghana
Immigrants from Liberia
Poverty
Poverty Comparison
Immigrants from Ghana
Immigrants from Liberia
14.2%
POVERTY
0.2/ 100
METRIC RATING
249th/ 347
METRIC RANK
14.4%
POVERTY
0.1/ 100
METRIC RATING
262nd/ 347
METRIC RANK
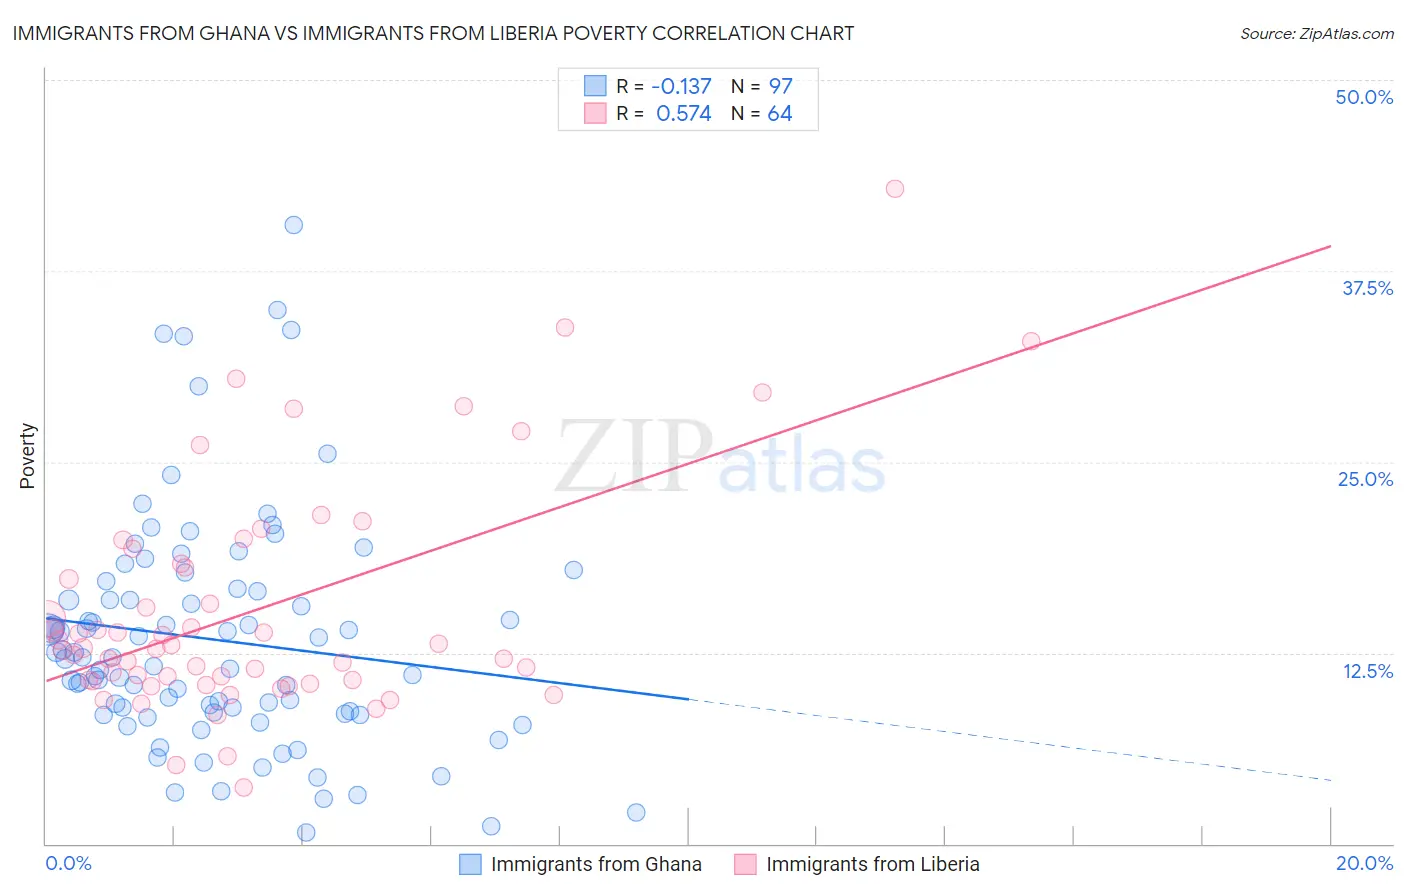
Immigrants from Ghana vs Immigrants from Liberia Poverty Correlation Chart
The statistical analysis conducted on geographies consisting of 199,808,032 people shows a poor negative correlation between the proportion of Immigrants from Ghana and poverty level in the United States with a correlation coefficient (R) of -0.137 and weighted average of 14.2%. Similarly, the statistical analysis conducted on geographies consisting of 135,251,059 people shows a substantial positive correlation between the proportion of Immigrants from Liberia and poverty level in the United States with a correlation coefficient (R) of 0.574 and weighted average of 14.4%, a difference of 1.6%.
Poverty Correlation Summary
| Measurement | Immigrants from Ghana | Immigrants from Liberia |
| Minimum | 0.71% | 3.7% |
| Maximum | 40.5% | 42.9% |
| Range | 39.8% | 39.2% |
| Mean | 13.4% | 15.3% |
| Median | 12.2% | 12.8% |
| Interquartile 25% (IQ1) | 8.5% | 10.7% |
| Interquartile 75% (IQ3) | 16.6% | 18.2% |
| Interquartile Range (IQR) | 8.1% | 7.5% |
| Standard Deviation (Sample) | 7.6% | 7.6% |
| Standard Deviation (Population) | 7.5% | 7.5% |
Demographics Similar to Immigrants from Ghana and Immigrants from Liberia by Poverty
In terms of poverty, the demographic groups most similar to Immigrants from Ghana are Immigrants from Western Africa (14.1%, a difference of 0.090%), Liberian (14.1%, a difference of 0.11%), Cree (14.2%, a difference of 0.30%), Immigrants from Burma/Myanmar (14.2%, a difference of 0.39%), and Potawatomi (14.1%, a difference of 0.40%). Similarly, the demographic groups most similar to Immigrants from Liberia are Cherokee (14.4%, a difference of 0.16%), Cape Verdean (14.4%, a difference of 0.18%), Immigrants from Nicaragua (14.3%, a difference of 0.26%), Jamaican (14.4%, a difference of 0.35%), and Immigrants from Jamaica (14.4%, a difference of 0.43%).
| Demographics | Rating | Rank | Poverty |
| Immigrants | Sudan | 0.3 /100 | #245 | Tragic 14.1% |
| Potawatomi | 0.3 /100 | #246 | Tragic 14.1% |
| Liberians | 0.2 /100 | #247 | Tragic 14.1% |
| Immigrants | Western Africa | 0.2 /100 | #248 | Tragic 14.1% |
| Immigrants | Ghana | 0.2 /100 | #249 | Tragic 14.2% |
| Cree | 0.2 /100 | #250 | Tragic 14.2% |
| Immigrants | Burma/Myanmar | 0.2 /100 | #251 | Tragic 14.2% |
| Spanish American Indians | 0.2 /100 | #252 | Tragic 14.2% |
| Immigrants | Trinidad and Tobago | 0.2 /100 | #253 | Tragic 14.2% |
| Immigrants | El Salvador | 0.1 /100 | #254 | Tragic 14.3% |
| Immigrants | Ecuador | 0.1 /100 | #255 | Tragic 14.3% |
| Mexican American Indians | 0.1 /100 | #256 | Tragic 14.3% |
| Trinidadians and Tobagonians | 0.1 /100 | #257 | Tragic 14.3% |
| Ottawa | 0.1 /100 | #258 | Tragic 14.3% |
| Immigrants | Nicaragua | 0.1 /100 | #259 | Tragic 14.3% |
| Cape Verdeans | 0.1 /100 | #260 | Tragic 14.4% |
| Cherokee | 0.1 /100 | #261 | Tragic 14.4% |
| Immigrants | Liberia | 0.1 /100 | #262 | Tragic 14.4% |
| Jamaicans | 0.1 /100 | #263 | Tragic 14.4% |
| Immigrants | Jamaica | 0.1 /100 | #264 | Tragic 14.4% |
| Immigrants | Guyana | 0.1 /100 | #265 | Tragic 14.5% |