Ecuadorian vs Immigrants from Liberia Poverty
COMPARE
Ecuadorian
Immigrants from Liberia
Poverty
Poverty Comparison
Ecuadorians
Immigrants from Liberia
14.0%
POVERTY
0.4/ 100
METRIC RATING
242nd/ 347
METRIC RANK
14.4%
POVERTY
0.1/ 100
METRIC RATING
262nd/ 347
METRIC RANK
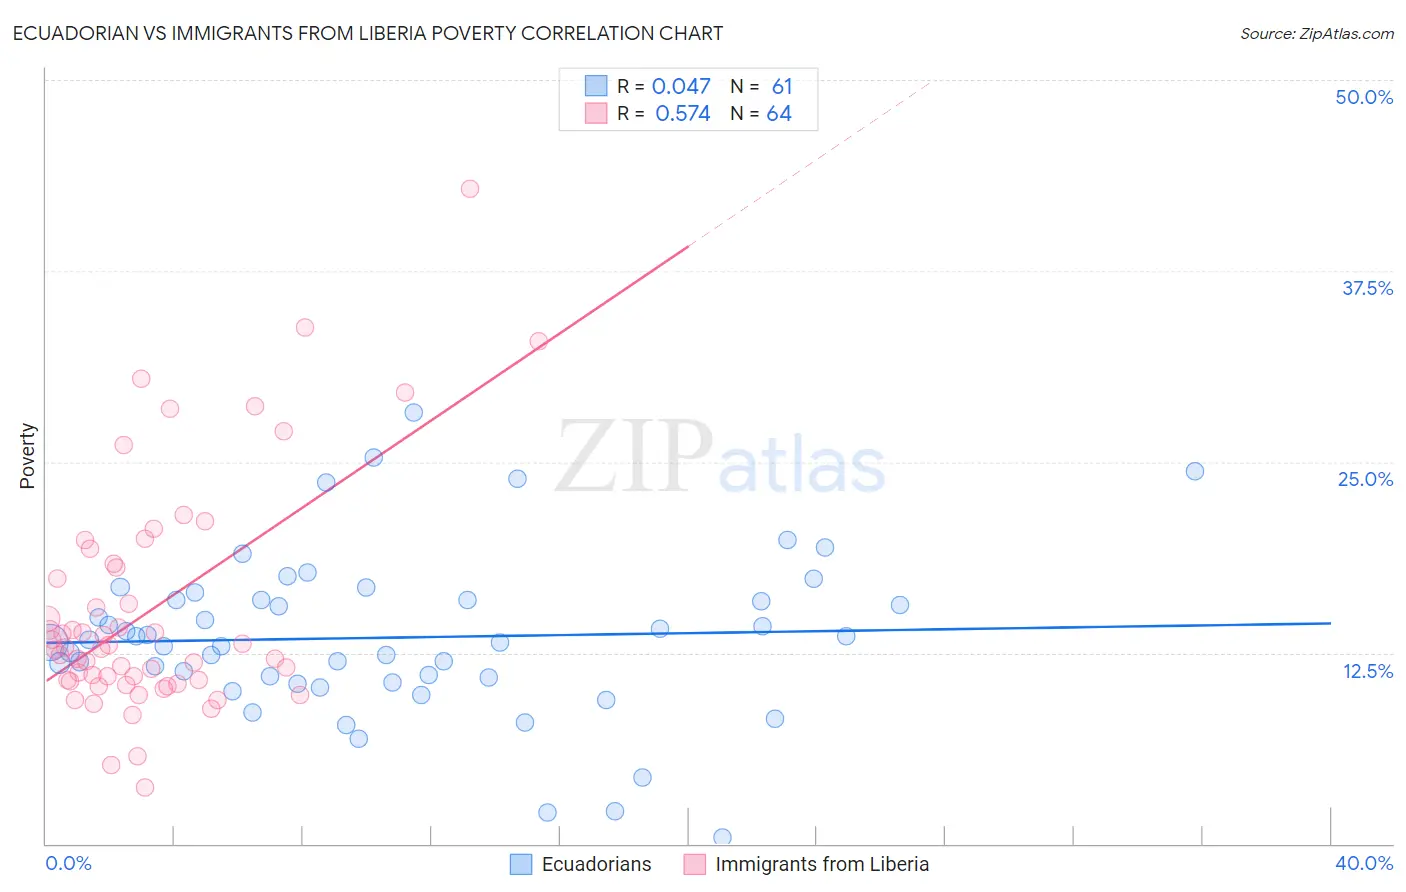
Ecuadorian vs Immigrants from Liberia Poverty Correlation Chart
The statistical analysis conducted on geographies consisting of 317,659,954 people shows no correlation between the proportion of Ecuadorians and poverty level in the United States with a correlation coefficient (R) of 0.047 and weighted average of 14.0%. Similarly, the statistical analysis conducted on geographies consisting of 135,251,059 people shows a substantial positive correlation between the proportion of Immigrants from Liberia and poverty level in the United States with a correlation coefficient (R) of 0.574 and weighted average of 14.4%, a difference of 2.7%.
Poverty Correlation Summary
| Measurement | Ecuadorian | Immigrants from Liberia |
| Minimum | 0.41% | 3.7% |
| Maximum | 28.2% | 42.9% |
| Range | 27.8% | 39.2% |
| Mean | 13.5% | 15.3% |
| Median | 13.2% | 12.8% |
| Interquartile 25% (IQ1) | 10.7% | 10.7% |
| Interquartile 75% (IQ3) | 16.0% | 18.2% |
| Interquartile Range (IQR) | 5.3% | 7.5% |
| Standard Deviation (Sample) | 5.3% | 7.6% |
| Standard Deviation (Population) | 5.3% | 7.5% |
Demographics Similar to Ecuadorians and Immigrants from Liberia by Poverty
In terms of poverty, the demographic groups most similar to Ecuadorians are Sudanese (14.0%, a difference of 0.070%), Nepalese (14.0%, a difference of 0.10%), Immigrants from Sudan (14.1%, a difference of 0.49%), Potawatomi (14.1%, a difference of 0.68%), and Liberian (14.1%, a difference of 0.97%). Similarly, the demographic groups most similar to Immigrants from Liberia are Cherokee (14.4%, a difference of 0.16%), Cape Verdean (14.4%, a difference of 0.18%), Immigrants from Nicaragua (14.3%, a difference of 0.26%), Ottawa (14.3%, a difference of 0.53%), and Trinidadian and Tobagonian (14.3%, a difference of 0.54%).
| Demographics | Rating | Rank | Poverty |
| Ecuadorians | 0.4 /100 | #242 | Tragic 14.0% |
| Sudanese | 0.3 /100 | #243 | Tragic 14.0% |
| Nepalese | 0.3 /100 | #244 | Tragic 14.0% |
| Immigrants | Sudan | 0.3 /100 | #245 | Tragic 14.1% |
| Potawatomi | 0.3 /100 | #246 | Tragic 14.1% |
| Liberians | 0.2 /100 | #247 | Tragic 14.1% |
| Immigrants | Western Africa | 0.2 /100 | #248 | Tragic 14.1% |
| Immigrants | Ghana | 0.2 /100 | #249 | Tragic 14.2% |
| Cree | 0.2 /100 | #250 | Tragic 14.2% |
| Immigrants | Burma/Myanmar | 0.2 /100 | #251 | Tragic 14.2% |
| Spanish American Indians | 0.2 /100 | #252 | Tragic 14.2% |
| Immigrants | Trinidad and Tobago | 0.2 /100 | #253 | Tragic 14.2% |
| Immigrants | El Salvador | 0.1 /100 | #254 | Tragic 14.3% |
| Immigrants | Ecuador | 0.1 /100 | #255 | Tragic 14.3% |
| Mexican American Indians | 0.1 /100 | #256 | Tragic 14.3% |
| Trinidadians and Tobagonians | 0.1 /100 | #257 | Tragic 14.3% |
| Ottawa | 0.1 /100 | #258 | Tragic 14.3% |
| Immigrants | Nicaragua | 0.1 /100 | #259 | Tragic 14.3% |
| Cape Verdeans | 0.1 /100 | #260 | Tragic 14.4% |
| Cherokee | 0.1 /100 | #261 | Tragic 14.4% |
| Immigrants | Liberia | 0.1 /100 | #262 | Tragic 14.4% |