Scottish vs Peruvian Poverty
COMPARE
Scottish
Peruvian
Poverty
Poverty Comparison
Scottish
Peruvians
11.5%
POVERTY
94.0/ 100
METRIC RATING
100th/ 347
METRIC RANK
11.8%
POVERTY
85.6/ 100
METRIC RATING
132nd/ 347
METRIC RANK
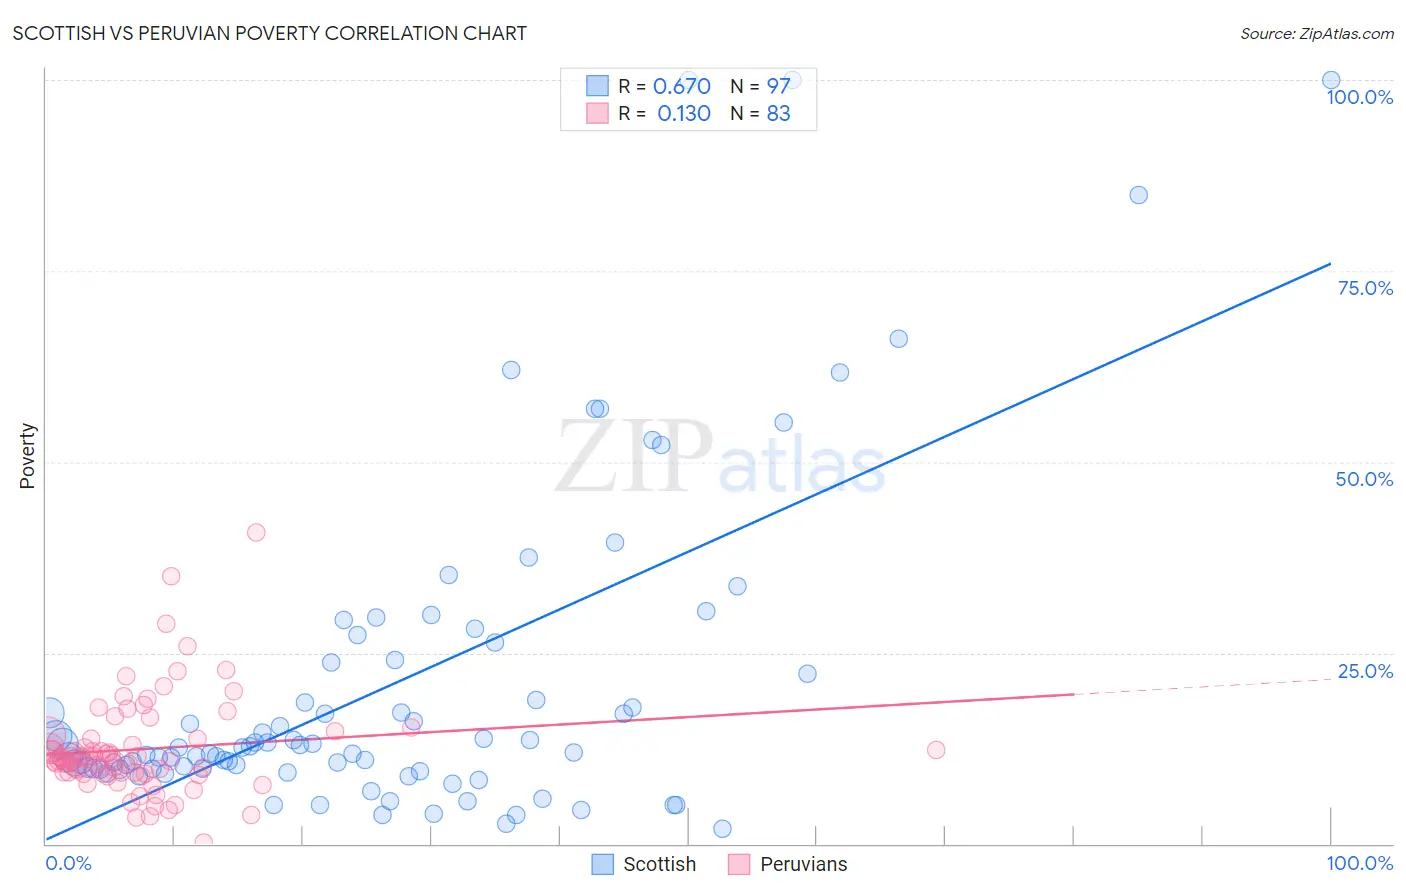
Scottish vs Peruvian Poverty Correlation Chart
The statistical analysis conducted on geographies consisting of 566,309,495 people shows a significant positive correlation between the proportion of Scottish and poverty level in the United States with a correlation coefficient (R) of 0.670 and weighted average of 11.5%. Similarly, the statistical analysis conducted on geographies consisting of 363,001,635 people shows a poor positive correlation between the proportion of Peruvians and poverty level in the United States with a correlation coefficient (R) of 0.130 and weighted average of 11.8%, a difference of 2.5%.
Poverty Correlation Summary
| Measurement | Scottish | Peruvian |
| Minimum | 1.9% | 0.14% |
| Maximum | 100.0% | 40.8% |
| Range | 98.1% | 40.7% |
| Mean | 20.9% | 12.4% |
| Median | 12.6% | 11.2% |
| Interquartile 25% (IQ1) | 9.8% | 9.2% |
| Interquartile 75% (IQ3) | 23.9% | 13.8% |
| Interquartile Range (IQR) | 14.1% | 4.6% |
| Standard Deviation (Sample) | 21.4% | 6.5% |
| Standard Deviation (Population) | 21.3% | 6.4% |
Similar Demographics by Poverty
Demographics Similar to Scottish by Poverty
In terms of poverty, the demographic groups most similar to Scottish are Immigrants from Indonesia (11.5%, a difference of 0.11%), Immigrants from Latvia (11.5%, a difference of 0.24%), Immigrants from Egypt (11.5%, a difference of 0.28%), Immigrants from South Africa (11.5%, a difference of 0.31%), and Slavic (11.5%, a difference of 0.31%).
| Demographics | Rating | Rank | Poverty |
| Romanians | 94.9 /100 | #93 | Exceptional 11.4% |
| Paraguayans | 94.9 /100 | #94 | Exceptional 11.4% |
| Australians | 94.9 /100 | #95 | Exceptional 11.4% |
| Immigrants | South Africa | 94.7 /100 | #96 | Exceptional 11.5% |
| Immigrants | Egypt | 94.6 /100 | #97 | Exceptional 11.5% |
| Immigrants | Latvia | 94.5 /100 | #98 | Exceptional 11.5% |
| Immigrants | Indonesia | 94.2 /100 | #99 | Exceptional 11.5% |
| Scottish | 94.0 /100 | #100 | Exceptional 11.5% |
| Slavs | 93.3 /100 | #101 | Exceptional 11.5% |
| Laotians | 92.4 /100 | #102 | Exceptional 11.6% |
| Okinawans | 92.4 /100 | #103 | Exceptional 11.6% |
| Native Hawaiians | 92.1 /100 | #104 | Exceptional 11.6% |
| Portuguese | 92.1 /100 | #105 | Exceptional 11.6% |
| Immigrants | Zimbabwe | 92.1 /100 | #106 | Exceptional 11.6% |
| Palestinians | 91.8 /100 | #107 | Exceptional 11.6% |
Demographics Similar to Peruvians by Poverty
In terms of poverty, the demographic groups most similar to Peruvians are Immigrants from Western Europe (11.8%, a difference of 0.070%), Yugoslavian (11.8%, a difference of 0.080%), Immigrants from Vietnam (11.8%, a difference of 0.090%), French (11.8%, a difference of 0.11%), and Immigrants from Ukraine (11.8%, a difference of 0.21%).
| Demographics | Rating | Rank | Poverty |
| Immigrants | Brazil | 88.2 /100 | #125 | Excellent 11.7% |
| Immigrants | Norway | 88.0 /100 | #126 | Excellent 11.7% |
| Immigrants | Argentina | 88.0 /100 | #127 | Excellent 11.7% |
| Immigrants | Israel | 87.4 /100 | #128 | Excellent 11.7% |
| South Africans | 87.0 /100 | #129 | Excellent 11.7% |
| Immigrants | Ukraine | 86.6 /100 | #130 | Excellent 11.8% |
| French | 86.1 /100 | #131 | Excellent 11.8% |
| Peruvians | 85.6 /100 | #132 | Excellent 11.8% |
| Immigrants | Western Europe | 85.2 /100 | #133 | Excellent 11.8% |
| Yugoslavians | 85.2 /100 | #134 | Excellent 11.8% |
| Immigrants | Vietnam | 85.2 /100 | #135 | Excellent 11.8% |
| Chileans | 84.2 /100 | #136 | Excellent 11.8% |
| Immigrants | Switzerland | 83.0 /100 | #137 | Excellent 11.8% |
| Immigrants | Jordan | 82.4 /100 | #138 | Excellent 11.9% |
| Pakistanis | 82.2 /100 | #139 | Excellent 11.9% |