Alaska Native vs Immigrants from Liberia Poverty
COMPARE
Alaska Native
Immigrants from Liberia
Poverty
Poverty Comparison
Alaska Natives
Immigrants from Liberia
13.5%
POVERTY
2.1/ 100
METRIC RATING
227th/ 347
METRIC RANK
14.4%
POVERTY
0.1/ 100
METRIC RATING
262nd/ 347
METRIC RANK
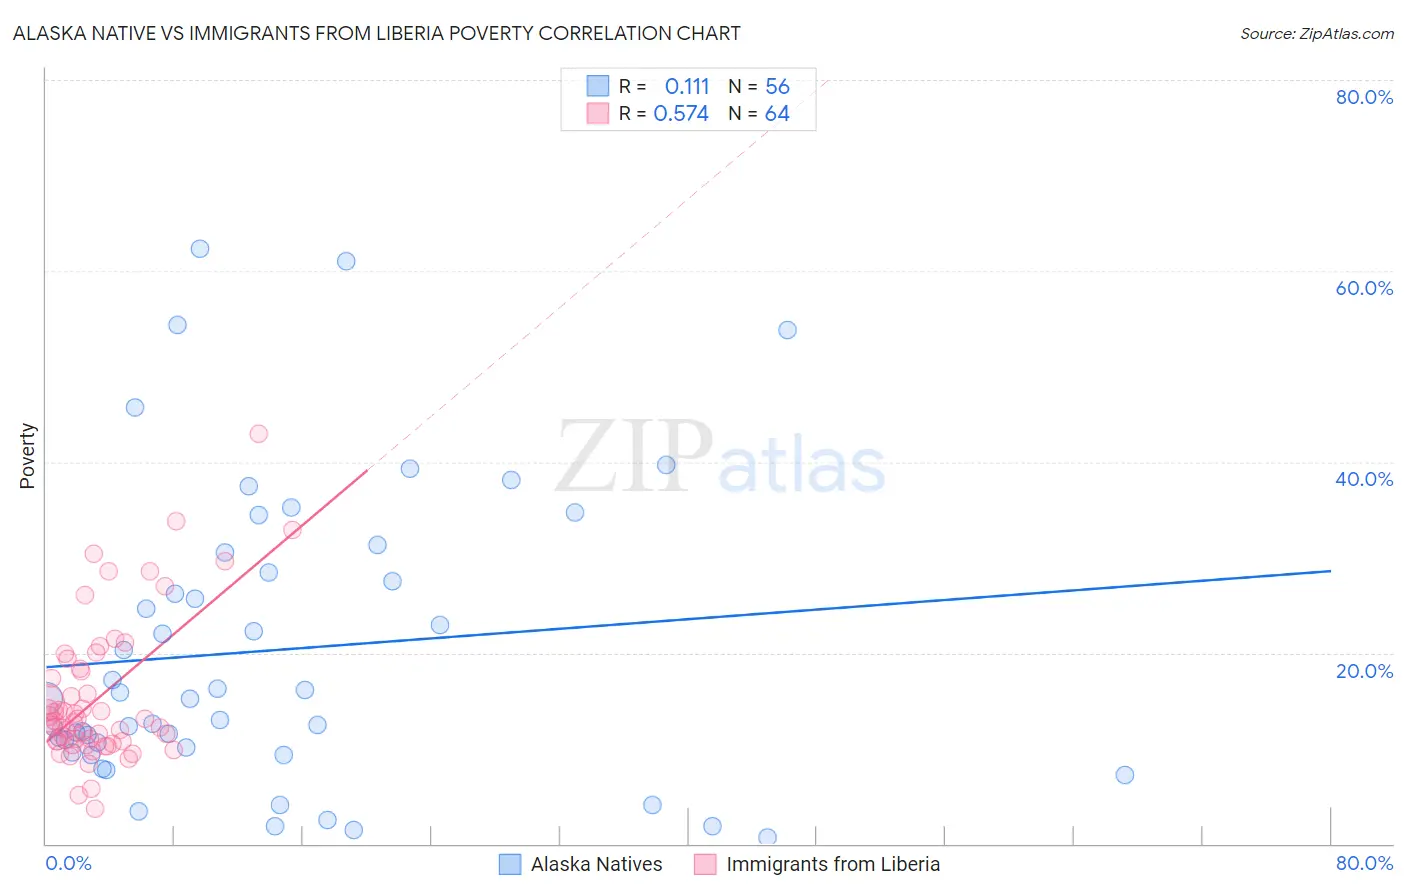
Alaska Native vs Immigrants from Liberia Poverty Correlation Chart
The statistical analysis conducted on geographies consisting of 76,760,249 people shows a poor positive correlation between the proportion of Alaska Natives and poverty level in the United States with a correlation coefficient (R) of 0.111 and weighted average of 13.5%. Similarly, the statistical analysis conducted on geographies consisting of 135,251,059 people shows a substantial positive correlation between the proportion of Immigrants from Liberia and poverty level in the United States with a correlation coefficient (R) of 0.574 and weighted average of 14.4%, a difference of 6.7%.
Poverty Correlation Summary
| Measurement | Alaska Native | Immigrants from Liberia |
| Minimum | 0.63% | 3.7% |
| Maximum | 62.3% | 42.9% |
| Range | 61.6% | 39.2% |
| Mean | 20.3% | 15.3% |
| Median | 15.2% | 12.8% |
| Interquartile 25% (IQ1) | 9.8% | 10.7% |
| Interquartile 75% (IQ3) | 29.5% | 18.2% |
| Interquartile Range (IQR) | 19.7% | 7.5% |
| Standard Deviation (Sample) | 15.5% | 7.6% |
| Standard Deviation (Population) | 15.4% | 7.5% |
Similar Demographics by Poverty
Demographics Similar to Alaska Natives by Poverty
In terms of poverty, the demographic groups most similar to Alaska Natives are Marshallese (13.4%, a difference of 0.15%), German Russian (13.4%, a difference of 0.16%), Immigrants from Eritrea (13.4%, a difference of 0.38%), Immigrants from Nigeria (13.5%, a difference of 0.45%), and Immigrants from Africa (13.4%, a difference of 0.48%).
| Demographics | Rating | Rank | Poverty |
| Americans | 2.9 /100 | #220 | Tragic 13.4% |
| Alsatians | 2.6 /100 | #221 | Tragic 13.4% |
| Immigrants | Micronesia | 2.6 /100 | #222 | Tragic 13.4% |
| Immigrants | Africa | 2.5 /100 | #223 | Tragic 13.4% |
| Immigrants | Eritrea | 2.4 /100 | #224 | Tragic 13.4% |
| German Russians | 2.2 /100 | #225 | Tragic 13.4% |
| Marshallese | 2.2 /100 | #226 | Tragic 13.4% |
| Alaska Natives | 2.1 /100 | #227 | Tragic 13.5% |
| Immigrants | Nigeria | 1.7 /100 | #228 | Tragic 13.5% |
| Osage | 1.5 /100 | #229 | Tragic 13.6% |
| Alaskan Athabascans | 1.5 /100 | #230 | Tragic 13.6% |
| Nigerians | 1.4 /100 | #231 | Tragic 13.6% |
| Fijians | 0.8 /100 | #232 | Tragic 13.7% |
| Immigrants | Saudi Arabia | 0.8 /100 | #233 | Tragic 13.8% |
| Immigrants | Laos | 0.7 /100 | #234 | Tragic 13.8% |
Demographics Similar to Immigrants from Liberia by Poverty
In terms of poverty, the demographic groups most similar to Immigrants from Liberia are Cherokee (14.4%, a difference of 0.16%), Cape Verdean (14.4%, a difference of 0.18%), Immigrants from Nicaragua (14.3%, a difference of 0.26%), Jamaican (14.4%, a difference of 0.35%), and Immigrants from Jamaica (14.4%, a difference of 0.43%).
| Demographics | Rating | Rank | Poverty |
| Immigrants | Ecuador | 0.1 /100 | #255 | Tragic 14.3% |
| Mexican American Indians | 0.1 /100 | #256 | Tragic 14.3% |
| Trinidadians and Tobagonians | 0.1 /100 | #257 | Tragic 14.3% |
| Ottawa | 0.1 /100 | #258 | Tragic 14.3% |
| Immigrants | Nicaragua | 0.1 /100 | #259 | Tragic 14.3% |
| Cape Verdeans | 0.1 /100 | #260 | Tragic 14.4% |
| Cherokee | 0.1 /100 | #261 | Tragic 14.4% |
| Immigrants | Liberia | 0.1 /100 | #262 | Tragic 14.4% |
| Jamaicans | 0.1 /100 | #263 | Tragic 14.4% |
| Immigrants | Jamaica | 0.1 /100 | #264 | Tragic 14.4% |
| Immigrants | Guyana | 0.1 /100 | #265 | Tragic 14.5% |
| Guyanese | 0.1 /100 | #266 | Tragic 14.5% |
| Iroquois | 0.1 /100 | #267 | Tragic 14.5% |
| Sub-Saharan Africans | 0.1 /100 | #268 | Tragic 14.5% |
| Immigrants | Cuba | 0.1 /100 | #269 | Tragic 14.6% |