Fijian vs Yugoslavian Poverty
COMPARE
Fijian
Yugoslavian
Poverty
Poverty Comparison
Fijians
Yugoslavians
13.7%
POVERTY
0.8/ 100
METRIC RATING
232nd/ 347
METRIC RANK
11.8%
POVERTY
85.2/ 100
METRIC RATING
134th/ 347
METRIC RANK
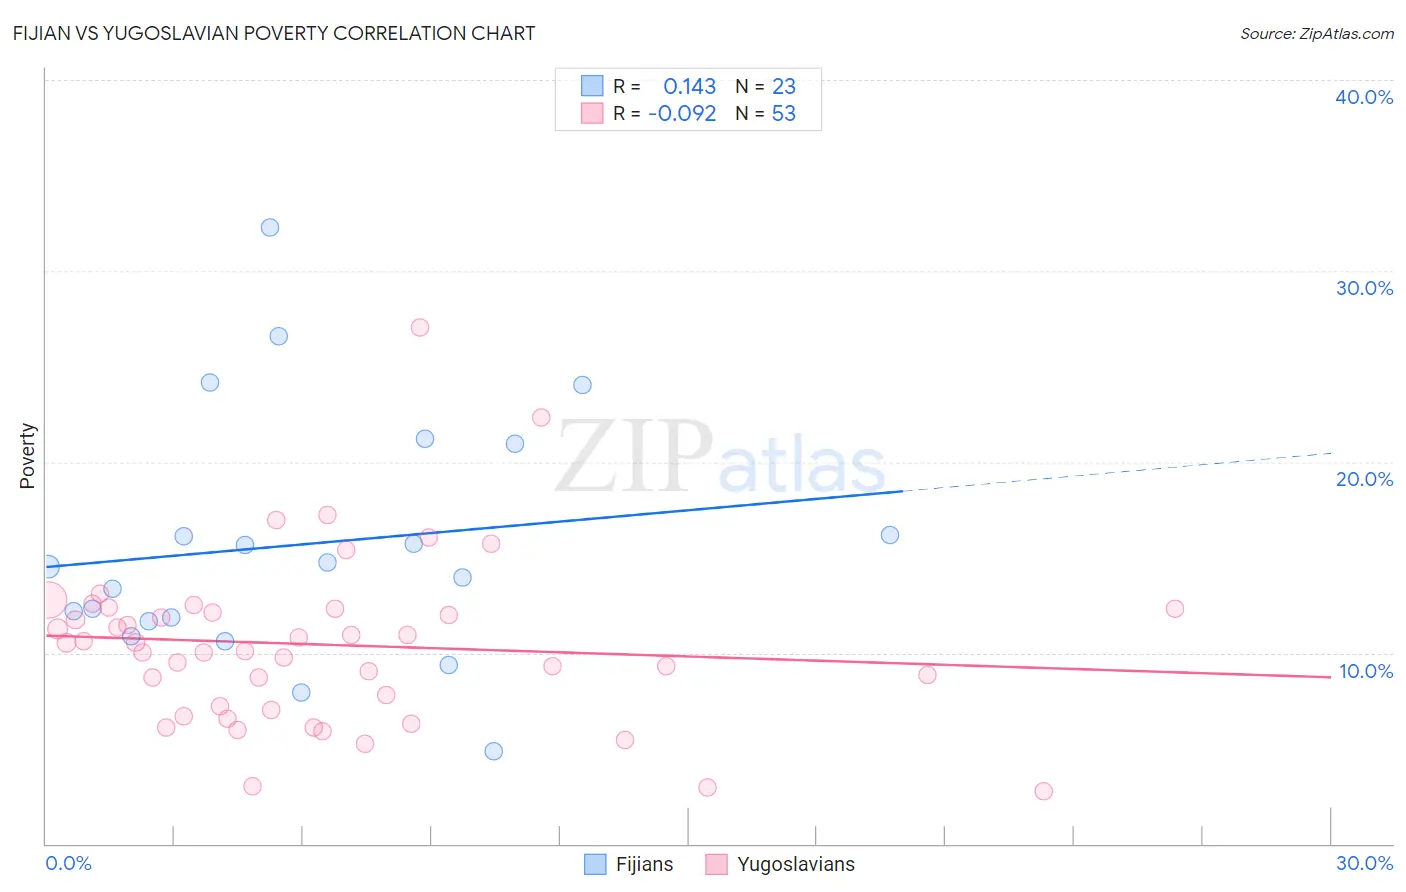
Fijian vs Yugoslavian Poverty Correlation Chart
The statistical analysis conducted on geographies consisting of 55,947,896 people shows a poor positive correlation between the proportion of Fijians and poverty level in the United States with a correlation coefficient (R) of 0.143 and weighted average of 13.7%. Similarly, the statistical analysis conducted on geographies consisting of 285,571,582 people shows a slight negative correlation between the proportion of Yugoslavians and poverty level in the United States with a correlation coefficient (R) of -0.092 and weighted average of 11.8%, a difference of 16.5%.
Poverty Correlation Summary
| Measurement | Fijian | Yugoslavian |
| Minimum | 4.9% | 2.7% |
| Maximum | 32.3% | 27.0% |
| Range | 27.5% | 24.3% |
| Mean | 15.7% | 10.4% |
| Median | 14.5% | 10.5% |
| Interquartile 25% (IQ1) | 11.7% | 7.1% |
| Interquartile 75% (IQ3) | 21.0% | 12.3% |
| Interquartile Range (IQR) | 9.3% | 5.2% |
| Standard Deviation (Sample) | 6.5% | 4.4% |
| Standard Deviation (Population) | 6.3% | 4.4% |
Similar Demographics by Poverty
Demographics Similar to Fijians by Poverty
In terms of poverty, the demographic groups most similar to Fijians are Immigrants from Saudi Arabia (13.8%, a difference of 0.25%), Immigrants from Laos (13.8%, a difference of 0.49%), Cuban (13.9%, a difference of 0.93%), Immigrants from Armenia (13.9%, a difference of 0.96%), and French American Indian (13.9%, a difference of 0.98%).
| Demographics | Rating | Rank | Poverty |
| German Russians | 2.2 /100 | #225 | Tragic 13.4% |
| Marshallese | 2.2 /100 | #226 | Tragic 13.4% |
| Alaska Natives | 2.1 /100 | #227 | Tragic 13.5% |
| Immigrants | Nigeria | 1.7 /100 | #228 | Tragic 13.5% |
| Osage | 1.5 /100 | #229 | Tragic 13.6% |
| Alaskan Athabascans | 1.5 /100 | #230 | Tragic 13.6% |
| Nigerians | 1.4 /100 | #231 | Tragic 13.6% |
| Fijians | 0.8 /100 | #232 | Tragic 13.7% |
| Immigrants | Saudi Arabia | 0.8 /100 | #233 | Tragic 13.8% |
| Immigrants | Laos | 0.7 /100 | #234 | Tragic 13.8% |
| Cubans | 0.6 /100 | #235 | Tragic 13.9% |
| Immigrants | Armenia | 0.5 /100 | #236 | Tragic 13.9% |
| French American Indians | 0.5 /100 | #237 | Tragic 13.9% |
| Ghanaians | 0.5 /100 | #238 | Tragic 13.9% |
| Nicaraguans | 0.4 /100 | #239 | Tragic 13.9% |
Demographics Similar to Yugoslavians by Poverty
In terms of poverty, the demographic groups most similar to Yugoslavians are Immigrants from Western Europe (11.8%, a difference of 0.010%), Immigrants from Vietnam (11.8%, a difference of 0.010%), Peruvian (11.8%, a difference of 0.080%), French (11.8%, a difference of 0.19%), and Chilean (11.8%, a difference of 0.20%).
| Demographics | Rating | Rank | Poverty |
| Immigrants | Argentina | 88.0 /100 | #127 | Excellent 11.7% |
| Immigrants | Israel | 87.4 /100 | #128 | Excellent 11.7% |
| South Africans | 87.0 /100 | #129 | Excellent 11.7% |
| Immigrants | Ukraine | 86.6 /100 | #130 | Excellent 11.8% |
| French | 86.1 /100 | #131 | Excellent 11.8% |
| Peruvians | 85.6 /100 | #132 | Excellent 11.8% |
| Immigrants | Western Europe | 85.2 /100 | #133 | Excellent 11.8% |
| Yugoslavians | 85.2 /100 | #134 | Excellent 11.8% |
| Immigrants | Vietnam | 85.2 /100 | #135 | Excellent 11.8% |
| Chileans | 84.2 /100 | #136 | Excellent 11.8% |
| Immigrants | Switzerland | 83.0 /100 | #137 | Excellent 11.8% |
| Immigrants | Jordan | 82.4 /100 | #138 | Excellent 11.9% |
| Pakistanis | 82.2 /100 | #139 | Excellent 11.9% |
| Immigrants | Peru | 81.1 /100 | #140 | Excellent 11.9% |
| Immigrants | France | 80.5 /100 | #141 | Excellent 11.9% |