Scotch-Irish vs Mongolian Single Female Poverty
COMPARE
Scotch-Irish
Mongolian
Single Female Poverty
Single Female Poverty Comparison
Scotch-Irish
Mongolians
22.9%
SINGLE FEMALE POVERTY
0.3/ 100
METRIC RATING
263rd/ 347
METRIC RANK
20.2%
SINGLE FEMALE POVERTY
93.2/ 100
METRIC RATING
127th/ 347
METRIC RANK
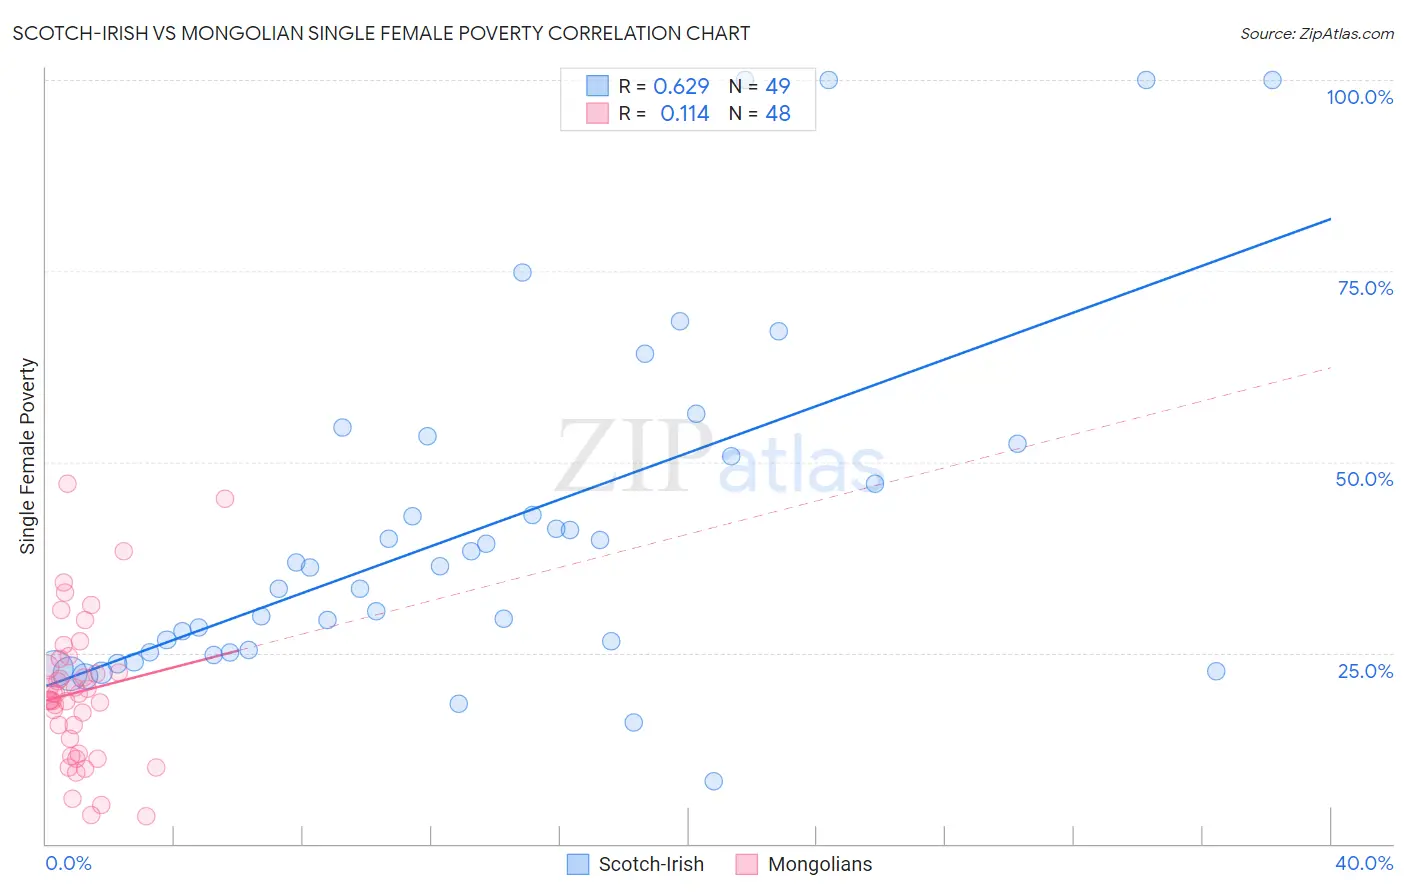
Scotch-Irish vs Mongolian Single Female Poverty Correlation Chart
The statistical analysis conducted on geographies consisting of 531,342,644 people shows a significant positive correlation between the proportion of Scotch-Irish and poverty level among single females in the United States with a correlation coefficient (R) of 0.629 and weighted average of 22.9%. Similarly, the statistical analysis conducted on geographies consisting of 139,671,707 people shows a poor positive correlation between the proportion of Mongolians and poverty level among single females in the United States with a correlation coefficient (R) of 0.114 and weighted average of 20.2%, a difference of 13.8%.
Single Female Poverty Correlation Summary
| Measurement | Scotch-Irish | Mongolian |
| Minimum | 8.1% | 3.5% |
| Maximum | 100.0% | 47.1% |
| Range | 91.9% | 43.6% |
| Mean | 41.2% | 19.9% |
| Median | 36.1% | 19.2% |
| Interquartile 25% (IQ1) | 25.0% | 12.8% |
| Interquartile 75% (IQ3) | 51.6% | 23.7% |
| Interquartile Range (IQR) | 26.6% | 10.9% |
| Standard Deviation (Sample) | 22.8% | 9.6% |
| Standard Deviation (Population) | 22.5% | 9.5% |
Similar Demographics by Single Female Poverty
Demographics Similar to Scotch-Irish by Single Female Poverty
In terms of single female poverty, the demographic groups most similar to Scotch-Irish are Immigrants from Laos (22.9%, a difference of 0.070%), Central American (23.0%, a difference of 0.24%), British West Indian (22.8%, a difference of 0.41%), Immigrants from Micronesia (23.0%, a difference of 0.45%), and Senegalese (23.0%, a difference of 0.51%).
| Demographics | Rating | Rank | Single Female Poverty |
| Immigrants | Belize | 0.8 /100 | #256 | Tragic 22.6% |
| Sudanese | 0.7 /100 | #257 | Tragic 22.6% |
| Bahamians | 0.6 /100 | #258 | Tragic 22.7% |
| Whites/Caucasians | 0.6 /100 | #259 | Tragic 22.7% |
| Celtics | 0.5 /100 | #260 | Tragic 22.7% |
| Immigrants | Cabo Verde | 0.4 /100 | #261 | Tragic 22.8% |
| British West Indians | 0.4 /100 | #262 | Tragic 22.8% |
| Scotch-Irish | 0.3 /100 | #263 | Tragic 22.9% |
| Immigrants | Laos | 0.3 /100 | #264 | Tragic 22.9% |
| Central Americans | 0.2 /100 | #265 | Tragic 23.0% |
| Immigrants | Micronesia | 0.2 /100 | #266 | Tragic 23.0% |
| Senegalese | 0.2 /100 | #267 | Tragic 23.0% |
| Fijians | 0.2 /100 | #268 | Tragic 23.1% |
| Hmong | 0.2 /100 | #269 | Tragic 23.1% |
| Inupiat | 0.2 /100 | #270 | Tragic 23.1% |
Demographics Similar to Mongolians by Single Female Poverty
In terms of single female poverty, the demographic groups most similar to Mongolians are Serbian (20.1%, a difference of 0.020%), Immigrants from Spain (20.2%, a difference of 0.11%), Immigrants from South Africa (20.1%, a difference of 0.19%), Immigrants from Morocco (20.2%, a difference of 0.19%), and Immigrants from Hungary (20.2%, a difference of 0.21%).
| Demographics | Rating | Rank | Single Female Poverty |
| South Americans | 95.1 /100 | #120 | Exceptional 20.0% |
| Immigrants | Switzerland | 95.1 /100 | #121 | Exceptional 20.0% |
| Immigrants | South America | 95.0 /100 | #122 | Exceptional 20.0% |
| Brazilians | 94.4 /100 | #123 | Exceptional 20.1% |
| Immigrants | Chile | 94.3 /100 | #124 | Exceptional 20.1% |
| Immigrants | South Africa | 93.9 /100 | #125 | Exceptional 20.1% |
| Serbians | 93.3 /100 | #126 | Exceptional 20.1% |
| Mongolians | 93.2 /100 | #127 | Exceptional 20.2% |
| Immigrants | Spain | 92.7 /100 | #128 | Exceptional 20.2% |
| Immigrants | Morocco | 92.4 /100 | #129 | Exceptional 20.2% |
| Immigrants | Hungary | 92.3 /100 | #130 | Exceptional 20.2% |
| Pakistanis | 92.1 /100 | #131 | Exceptional 20.2% |
| Uruguayans | 92.1 /100 | #132 | Exceptional 20.2% |
| Immigrants | England | 91.9 /100 | #133 | Exceptional 20.2% |
| Immigrants | Venezuela | 91.5 /100 | #134 | Exceptional 20.2% |