Scotch-Irish vs U.S. Virgin Islander Single Female Poverty
COMPARE
Scotch-Irish
U.S. Virgin Islander
Single Female Poverty
Single Female Poverty Comparison
Scotch-Irish
U.S. Virgin Islanders
22.9%
SINGLE FEMALE POVERTY
0.3/ 100
METRIC RATING
263rd/ 347
METRIC RANK
24.2%
SINGLE FEMALE POVERTY
0.0/ 100
METRIC RATING
289th/ 347
METRIC RANK
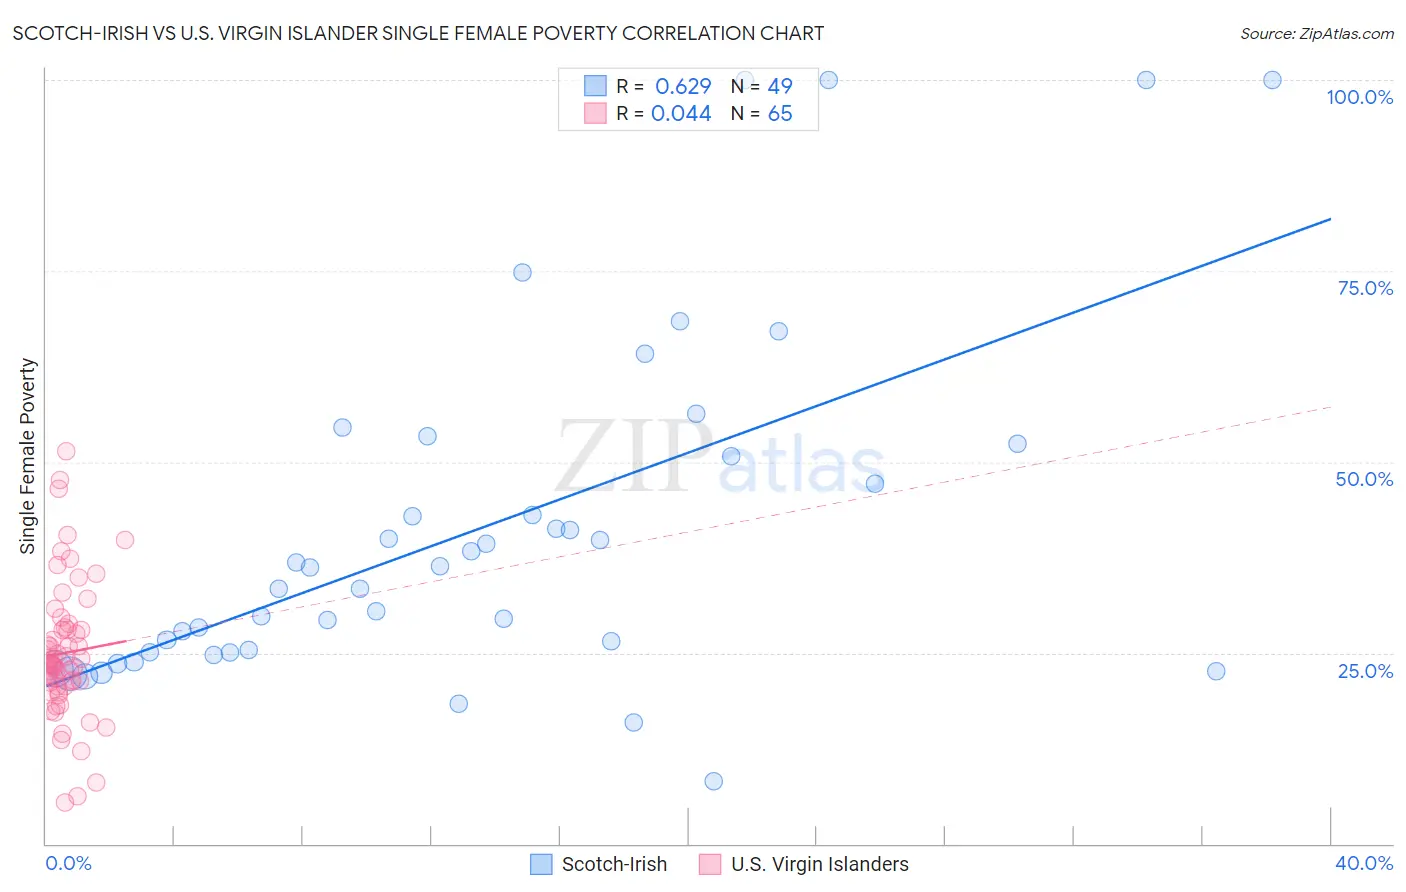
Scotch-Irish vs U.S. Virgin Islander Single Female Poverty Correlation Chart
The statistical analysis conducted on geographies consisting of 531,342,644 people shows a significant positive correlation between the proportion of Scotch-Irish and poverty level among single females in the United States with a correlation coefficient (R) of 0.629 and weighted average of 22.9%. Similarly, the statistical analysis conducted on geographies consisting of 87,304,073 people shows no correlation between the proportion of U.S. Virgin Islanders and poverty level among single females in the United States with a correlation coefficient (R) of 0.044 and weighted average of 24.2%, a difference of 5.4%.
Single Female Poverty Correlation Summary
| Measurement | Scotch-Irish | U.S. Virgin Islander |
| Minimum | 8.1% | 5.4% |
| Maximum | 100.0% | 51.4% |
| Range | 91.9% | 46.0% |
| Mean | 41.2% | 25.0% |
| Median | 36.1% | 23.5% |
| Interquartile 25% (IQ1) | 25.0% | 20.7% |
| Interquartile 75% (IQ3) | 51.6% | 28.2% |
| Interquartile Range (IQR) | 26.6% | 7.5% |
| Standard Deviation (Sample) | 22.8% | 8.9% |
| Standard Deviation (Population) | 22.5% | 8.9% |
Similar Demographics by Single Female Poverty
Demographics Similar to Scotch-Irish by Single Female Poverty
In terms of single female poverty, the demographic groups most similar to Scotch-Irish are Immigrants from Laos (22.9%, a difference of 0.070%), Central American (23.0%, a difference of 0.24%), British West Indian (22.8%, a difference of 0.41%), Immigrants from Micronesia (23.0%, a difference of 0.45%), and Senegalese (23.0%, a difference of 0.51%).
| Demographics | Rating | Rank | Single Female Poverty |
| Immigrants | Belize | 0.8 /100 | #256 | Tragic 22.6% |
| Sudanese | 0.7 /100 | #257 | Tragic 22.6% |
| Bahamians | 0.6 /100 | #258 | Tragic 22.7% |
| Whites/Caucasians | 0.6 /100 | #259 | Tragic 22.7% |
| Celtics | 0.5 /100 | #260 | Tragic 22.7% |
| Immigrants | Cabo Verde | 0.4 /100 | #261 | Tragic 22.8% |
| British West Indians | 0.4 /100 | #262 | Tragic 22.8% |
| Scotch-Irish | 0.3 /100 | #263 | Tragic 22.9% |
| Immigrants | Laos | 0.3 /100 | #264 | Tragic 22.9% |
| Central Americans | 0.2 /100 | #265 | Tragic 23.0% |
| Immigrants | Micronesia | 0.2 /100 | #266 | Tragic 23.0% |
| Senegalese | 0.2 /100 | #267 | Tragic 23.0% |
| Fijians | 0.2 /100 | #268 | Tragic 23.1% |
| Hmong | 0.2 /100 | #269 | Tragic 23.1% |
| Inupiat | 0.2 /100 | #270 | Tragic 23.1% |
Demographics Similar to U.S. Virgin Islanders by Single Female Poverty
In terms of single female poverty, the demographic groups most similar to U.S. Virgin Islanders are Spanish American (24.2%, a difference of 0.050%), Bangladeshi (24.2%, a difference of 0.070%), Cree (24.1%, a difference of 0.22%), Immigrants from Guatemala (24.1%, a difference of 0.26%), and Indonesian (24.3%, a difference of 0.34%).
| Demographics | Rating | Rank | Single Female Poverty |
| Guatemalans | 0.0 /100 | #282 | Tragic 23.8% |
| German Russians | 0.0 /100 | #283 | Tragic 23.9% |
| Immigrants | Dominica | 0.0 /100 | #284 | Tragic 23.9% |
| Immigrants | Guatemala | 0.0 /100 | #285 | Tragic 24.1% |
| Cree | 0.0 /100 | #286 | Tragic 24.1% |
| Bangladeshis | 0.0 /100 | #287 | Tragic 24.2% |
| Spanish Americans | 0.0 /100 | #288 | Tragic 24.2% |
| U.S. Virgin Islanders | 0.0 /100 | #289 | Tragic 24.2% |
| Indonesians | 0.0 /100 | #290 | Tragic 24.3% |
| Osage | 0.0 /100 | #291 | Tragic 24.4% |
| Alsatians | 0.0 /100 | #292 | Tragic 24.5% |
| Americans | 0.0 /100 | #293 | Tragic 24.5% |
| French American Indians | 0.0 /100 | #294 | Tragic 24.6% |
| Hispanics or Latinos | 0.0 /100 | #295 | Tragic 24.6% |
| Africans | 0.0 /100 | #296 | Tragic 24.8% |