Scotch-Irish vs Mongolian Unemployment Among Ages 16 to 19 years
COMPARE
Scotch-Irish
Mongolian
Unemployment Among Ages 16 to 19 years
Unemployment Among Ages 16 to 19 years Comparison
Scotch-Irish
Mongolians
16.6%
UNEMPLOYMENT AMONG AGES 16 TO 19 YEARS
99.1/ 100
METRIC RATING
63rd/ 347
METRIC RANK
16.9%
UNEMPLOYMENT AMONG AGES 16 TO 19 YEARS
95.6/ 100
METRIC RATING
95th/ 347
METRIC RANK
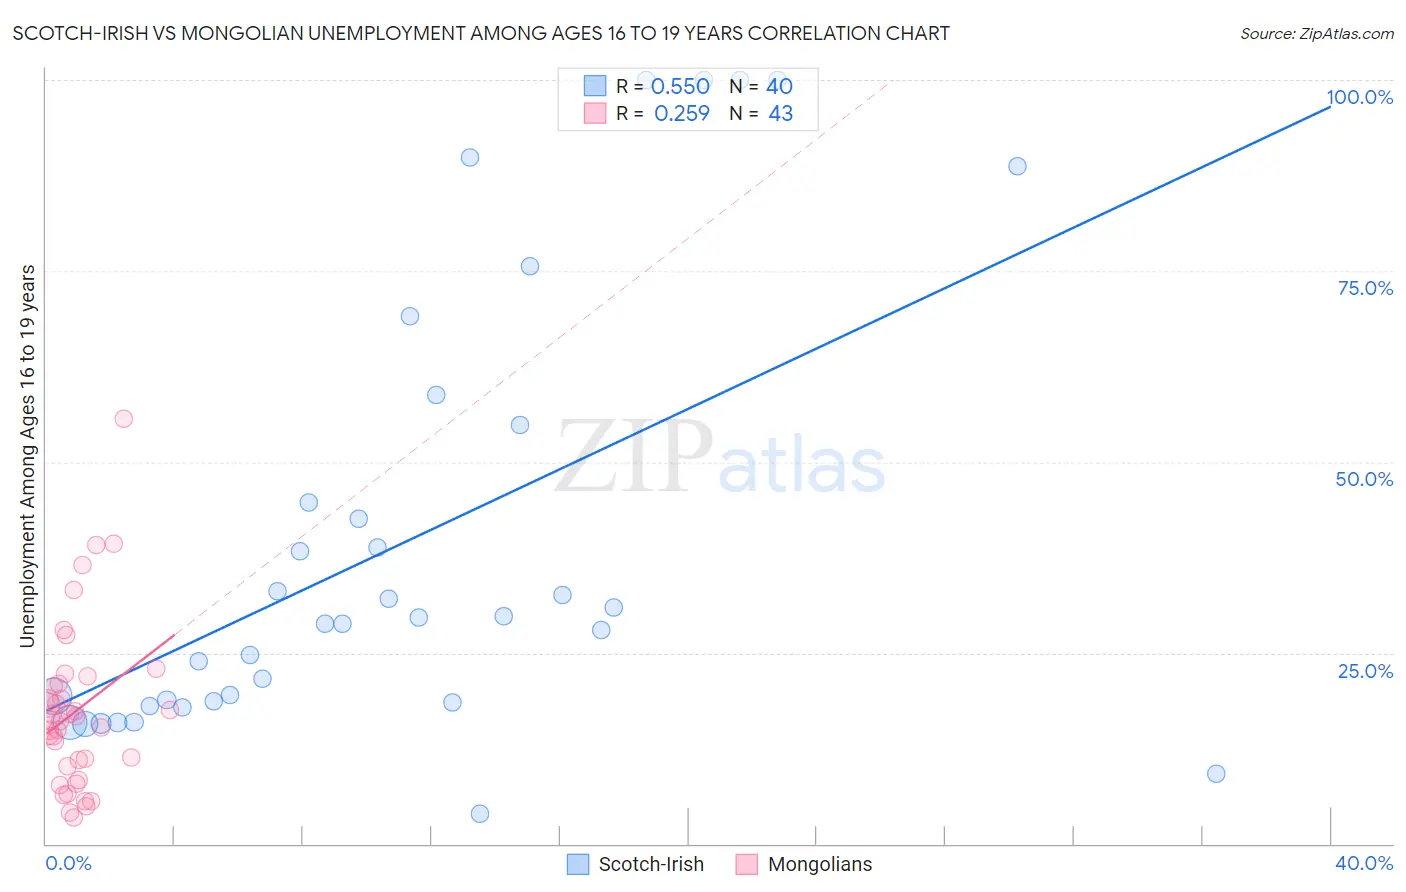
Scotch-Irish vs Mongolian Unemployment Among Ages 16 to 19 years Correlation Chart
The statistical analysis conducted on geographies consisting of 491,977,609 people shows a substantial positive correlation between the proportion of Scotch-Irish and unemployment rate among population between the ages 16 and 19 in the United States with a correlation coefficient (R) of 0.550 and weighted average of 16.6%. Similarly, the statistical analysis conducted on geographies consisting of 137,919,207 people shows a weak positive correlation between the proportion of Mongolians and unemployment rate among population between the ages 16 and 19 in the United States with a correlation coefficient (R) of 0.259 and weighted average of 16.9%, a difference of 2.0%.
Unemployment Among Ages 16 to 19 years Correlation Summary
| Measurement | Scotch-Irish | Mongolian |
| Minimum | 3.9% | 3.5% |
| Maximum | 100.0% | 55.6% |
| Range | 96.1% | 52.1% |
| Mean | 39.2% | 17.4% |
| Median | 29.2% | 16.1% |
| Interquartile 25% (IQ1) | 18.6% | 10.1% |
| Interquartile 75% (IQ3) | 49.8% | 21.0% |
| Interquartile Range (IQR) | 31.2% | 10.9% |
| Standard Deviation (Sample) | 28.6% | 10.8% |
| Standard Deviation (Population) | 28.3% | 10.7% |
Similar Demographics by Unemployment Among Ages 16 to 19 years
Demographics Similar to Scotch-Irish by Unemployment Among Ages 16 to 19 years
In terms of unemployment among ages 16 to 19 years, the demographic groups most similar to Scotch-Irish are Northern European (16.6%, a difference of 0.070%), Immigrants from Japan (16.6%, a difference of 0.16%), Macedonian (16.6%, a difference of 0.18%), Okinawan (16.6%, a difference of 0.20%), and Immigrants from Cuba (16.6%, a difference of 0.28%).
| Demographics | Rating | Rank | Unemployment Among Ages 16 to 19 years |
| Sri Lankans | 99.5 /100 | #56 | Exceptional 16.5% |
| Immigrants | Jordan | 99.4 /100 | #57 | Exceptional 16.5% |
| Immigrants | Uganda | 99.4 /100 | #58 | Exceptional 16.5% |
| Irish | 99.4 /100 | #59 | Exceptional 16.5% |
| Menominee | 99.3 /100 | #60 | Exceptional 16.6% |
| Immigrants | Cuba | 99.2 /100 | #61 | Exceptional 16.6% |
| Macedonians | 99.2 /100 | #62 | Exceptional 16.6% |
| Scotch-Irish | 99.1 /100 | #63 | Exceptional 16.6% |
| Northern Europeans | 99.0 /100 | #64 | Exceptional 16.6% |
| Immigrants | Japan | 98.9 /100 | #65 | Exceptional 16.6% |
| Okinawans | 98.9 /100 | #66 | Exceptional 16.6% |
| Slavs | 98.7 /100 | #67 | Exceptional 16.7% |
| Chickasaw | 98.7 /100 | #68 | Exceptional 16.7% |
| Serbians | 98.7 /100 | #69 | Exceptional 16.7% |
| Austrians | 98.6 /100 | #70 | Exceptional 16.7% |
Demographics Similar to Mongolians by Unemployment Among Ages 16 to 19 years
In terms of unemployment among ages 16 to 19 years, the demographic groups most similar to Mongolians are Ottawa (16.9%, a difference of 0.040%), Immigrants from Venezuela (16.9%, a difference of 0.060%), Bangladeshi (16.9%, a difference of 0.070%), Cuban (16.9%, a difference of 0.080%), and South African (16.9%, a difference of 0.12%).
| Demographics | Rating | Rank | Unemployment Among Ages 16 to 19 years |
| Immigrants | South Africa | 96.9 /100 | #88 | Exceptional 16.9% |
| Canadians | 96.7 /100 | #89 | Exceptional 16.9% |
| Asians | 96.6 /100 | #90 | Exceptional 16.9% |
| Cambodians | 96.3 /100 | #91 | Exceptional 16.9% |
| South Africans | 95.9 /100 | #92 | Exceptional 16.9% |
| Cubans | 95.8 /100 | #93 | Exceptional 16.9% |
| Bangladeshis | 95.8 /100 | #94 | Exceptional 16.9% |
| Mongolians | 95.6 /100 | #95 | Exceptional 16.9% |
| Ottawa | 95.4 /100 | #96 | Exceptional 16.9% |
| Immigrants | Venezuela | 95.3 /100 | #97 | Exceptional 16.9% |
| Burmese | 95.0 /100 | #98 | Exceptional 17.0% |
| Immigrants | Lithuania | 94.9 /100 | #99 | Exceptional 17.0% |
| Immigrants | Thailand | 94.7 /100 | #100 | Exceptional 17.0% |
| Immigrants | Saudi Arabia | 94.7 /100 | #101 | Exceptional 17.0% |
| Immigrants | Pakistan | 94.6 /100 | #102 | Exceptional 17.0% |