Scotch-Irish vs Immigrants from Hong Kong Receiving Food Stamps
COMPARE
Scotch-Irish
Immigrants from Hong Kong
Receiving Food Stamps
Receiving Food Stamps Comparison
Scotch-Irish
Immigrants from Hong Kong
10.5%
RECEIVING FOOD STAMPS
95.1/ 100
METRIC RATING
114th/ 347
METRIC RANK
9.1%
RECEIVING FOOD STAMPS
99.8/ 100
METRIC RATING
19th/ 347
METRIC RANK
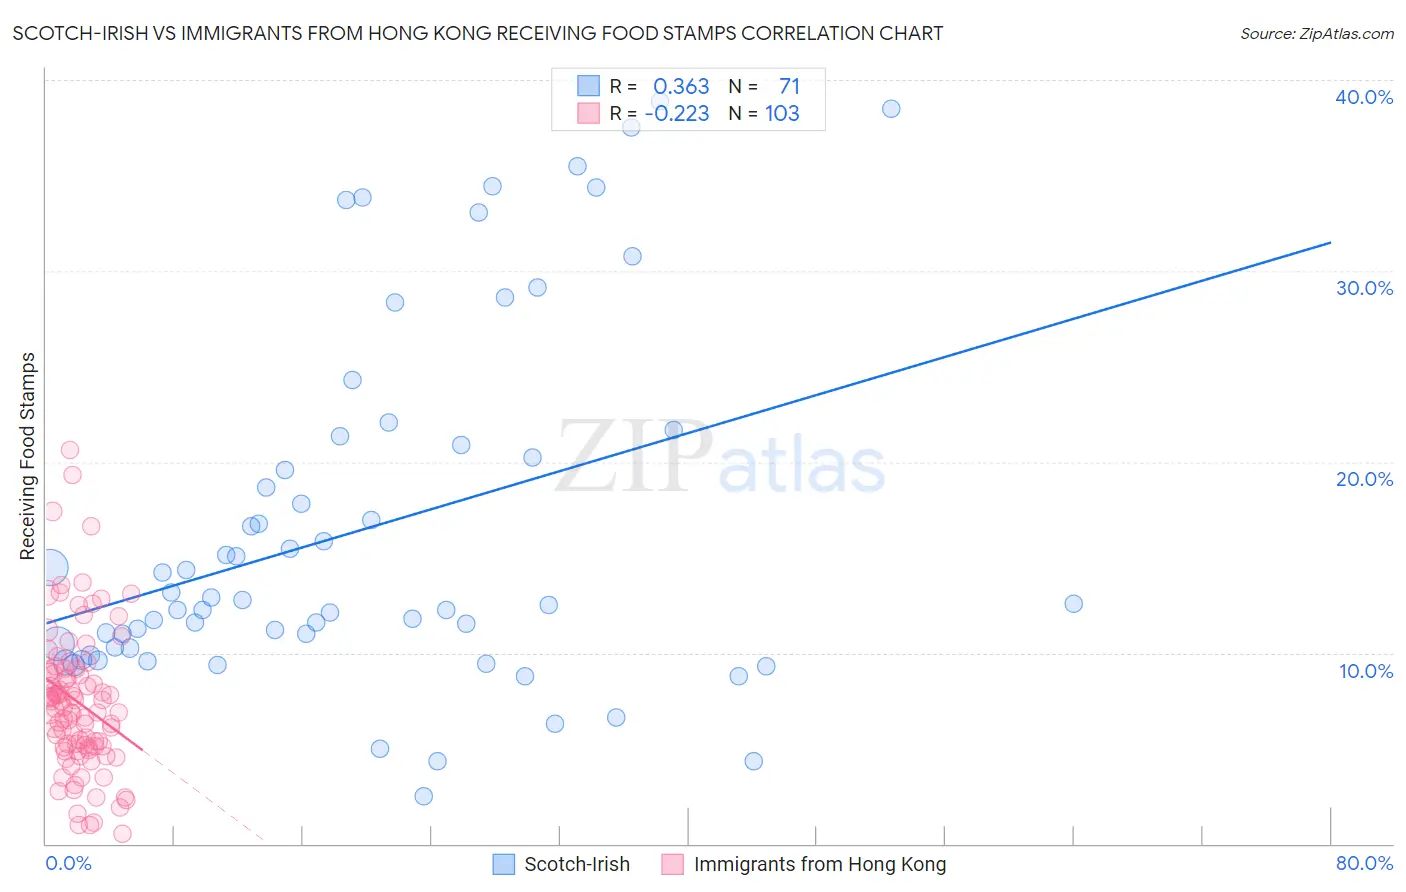
Scotch-Irish vs Immigrants from Hong Kong Receiving Food Stamps Correlation Chart
The statistical analysis conducted on geographies consisting of 546,022,543 people shows a mild positive correlation between the proportion of Scotch-Irish and percentage of population receiving government assistance and/or food stamps in the United States with a correlation coefficient (R) of 0.363 and weighted average of 10.5%. Similarly, the statistical analysis conducted on geographies consisting of 253,389,462 people shows a weak negative correlation between the proportion of Immigrants from Hong Kong and percentage of population receiving government assistance and/or food stamps in the United States with a correlation coefficient (R) of -0.223 and weighted average of 9.1%, a difference of 15.8%.
Receiving Food Stamps Correlation Summary
| Measurement | Scotch-Irish | Immigrants from Hong Kong |
| Minimum | 2.5% | 0.50% |
| Maximum | 38.9% | 20.6% |
| Range | 36.4% | 20.1% |
| Mean | 16.4% | 7.4% |
| Median | 12.6% | 7.0% |
| Interquartile 25% (IQ1) | 10.2% | 5.1% |
| Interquartile 75% (IQ3) | 20.9% | 9.0% |
| Interquartile Range (IQR) | 10.7% | 3.9% |
| Standard Deviation (Sample) | 9.3% | 3.8% |
| Standard Deviation (Population) | 9.2% | 3.8% |
Similar Demographics by Receiving Food Stamps
Demographics Similar to Scotch-Irish by Receiving Food Stamps
In terms of receiving food stamps, the demographic groups most similar to Scotch-Irish are Immigrants from Saudi Arabia (10.5%, a difference of 0.18%), Canadian (10.5%, a difference of 0.22%), Icelander (10.5%, a difference of 0.30%), Immigrants from Nepal (10.6%, a difference of 0.39%), and Mongolian (10.5%, a difference of 0.68%).
| Demographics | Rating | Rank | Receiving Food Stamps |
| Koreans | 96.3 /100 | #107 | Exceptional 10.4% |
| Carpatho Rusyns | 96.2 /100 | #108 | Exceptional 10.4% |
| Immigrants | Pakistan | 96.2 /100 | #109 | Exceptional 10.4% |
| Pakistanis | 95.9 /100 | #110 | Exceptional 10.4% |
| Romanians | 95.8 /100 | #111 | Exceptional 10.4% |
| Mongolians | 95.8 /100 | #112 | Exceptional 10.5% |
| Icelanders | 95.4 /100 | #113 | Exceptional 10.5% |
| Scotch-Irish | 95.1 /100 | #114 | Exceptional 10.5% |
| Immigrants | Saudi Arabia | 94.9 /100 | #115 | Exceptional 10.5% |
| Canadians | 94.8 /100 | #116 | Exceptional 10.5% |
| Immigrants | Nepal | 94.6 /100 | #117 | Exceptional 10.6% |
| Assyrians/Chaldeans/Syriacs | 94.1 /100 | #118 | Exceptional 10.6% |
| Immigrants | Poland | 93.9 /100 | #119 | Exceptional 10.6% |
| Ethiopians | 93.9 /100 | #120 | Exceptional 10.6% |
| Slavs | 93.8 /100 | #121 | Exceptional 10.6% |
Demographics Similar to Immigrants from Hong Kong by Receiving Food Stamps
In terms of receiving food stamps, the demographic groups most similar to Immigrants from Hong Kong are Latvian (9.1%, a difference of 0.33%), Luxembourger (9.1%, a difference of 0.48%), Danish (9.0%, a difference of 0.58%), Immigrants from Australia (9.2%, a difference of 0.73%), and Eastern European (9.2%, a difference of 0.84%).
| Demographics | Rating | Rank | Receiving Food Stamps |
| Cypriots | 99.9 /100 | #12 | Exceptional 8.9% |
| Bulgarians | 99.9 /100 | #13 | Exceptional 8.9% |
| Maltese | 99.9 /100 | #14 | Exceptional 8.9% |
| Norwegians | 99.9 /100 | #15 | Exceptional 9.0% |
| Immigrants | Japan | 99.9 /100 | #16 | Exceptional 9.0% |
| Immigrants | Scotland | 99.9 /100 | #17 | Exceptional 9.0% |
| Danes | 99.9 /100 | #18 | Exceptional 9.0% |
| Immigrants | Hong Kong | 99.8 /100 | #19 | Exceptional 9.1% |
| Latvians | 99.8 /100 | #20 | Exceptional 9.1% |
| Luxembourgers | 99.8 /100 | #21 | Exceptional 9.1% |
| Immigrants | Australia | 99.8 /100 | #22 | Exceptional 9.2% |
| Eastern Europeans | 99.8 /100 | #23 | Exceptional 9.2% |
| Immigrants | Northern Europe | 99.8 /100 | #24 | Exceptional 9.2% |
| Immigrants | Ireland | 99.8 /100 | #25 | Exceptional 9.2% |
| Swedes | 99.8 /100 | #26 | Exceptional 9.2% |