Immigrants from Saudi Arabia vs Immigrants from Hong Kong Receiving Food Stamps
COMPARE
Immigrants from Saudi Arabia
Immigrants from Hong Kong
Receiving Food Stamps
Receiving Food Stamps Comparison
Immigrants from Saudi Arabia
Immigrants from Hong Kong
10.5%
RECEIVING FOOD STAMPS
94.9/ 100
METRIC RATING
115th/ 347
METRIC RANK
9.1%
RECEIVING FOOD STAMPS
99.8/ 100
METRIC RATING
19th/ 347
METRIC RANK
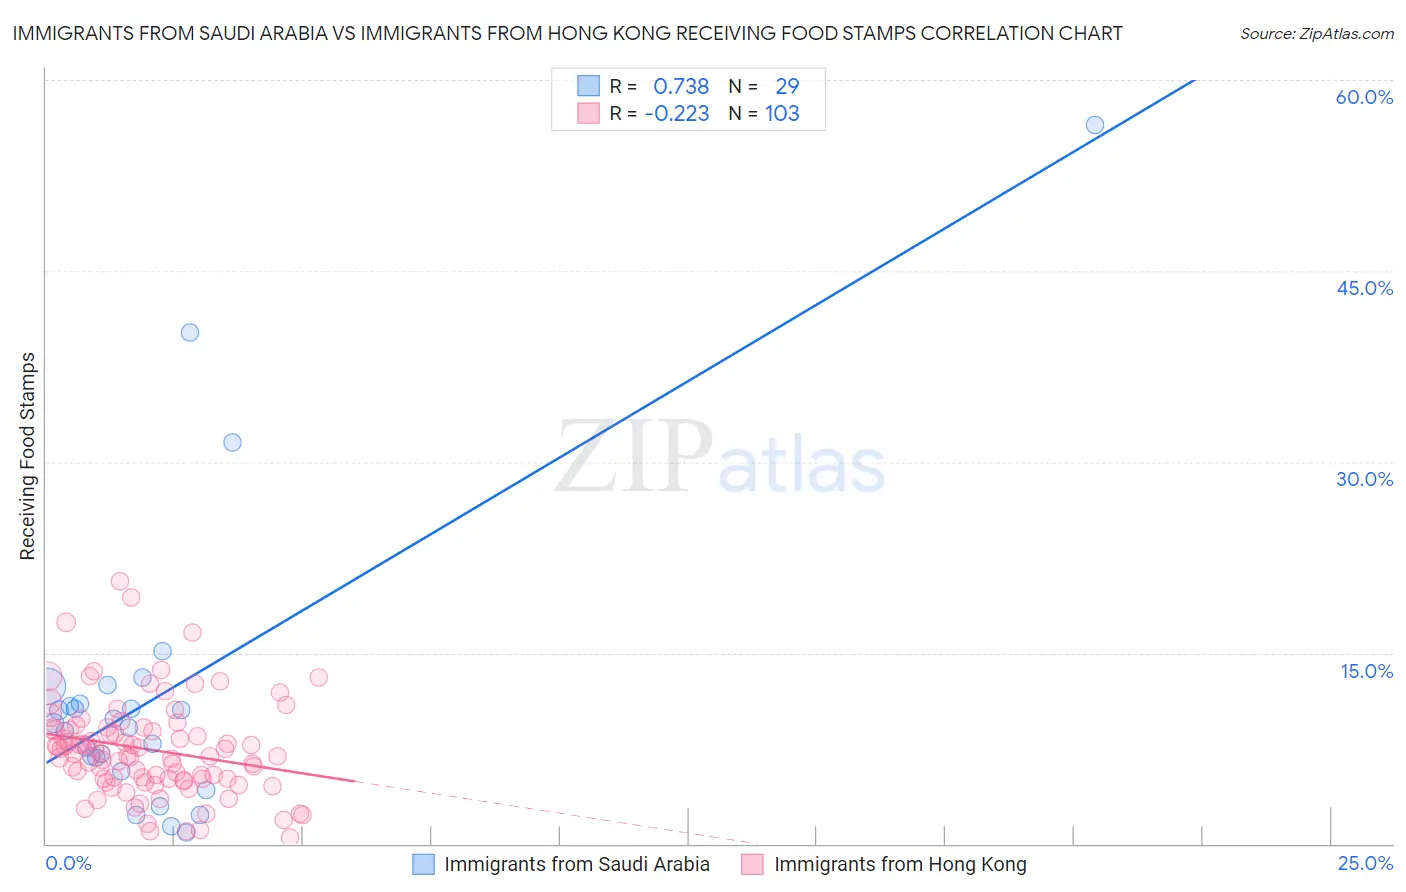
Immigrants from Saudi Arabia vs Immigrants from Hong Kong Receiving Food Stamps Correlation Chart
The statistical analysis conducted on geographies consisting of 164,113,449 people shows a strong positive correlation between the proportion of Immigrants from Saudi Arabia and percentage of population receiving government assistance and/or food stamps in the United States with a correlation coefficient (R) of 0.738 and weighted average of 10.5%. Similarly, the statistical analysis conducted on geographies consisting of 253,389,462 people shows a weak negative correlation between the proportion of Immigrants from Hong Kong and percentage of population receiving government assistance and/or food stamps in the United States with a correlation coefficient (R) of -0.223 and weighted average of 9.1%, a difference of 16.0%.
Receiving Food Stamps Correlation Summary
| Measurement | Immigrants from Saudi Arabia | Immigrants from Hong Kong |
| Minimum | 0.90% | 0.50% |
| Maximum | 56.5% | 20.6% |
| Range | 55.6% | 20.1% |
| Mean | 11.7% | 7.4% |
| Median | 9.5% | 7.0% |
| Interquartile 25% (IQ1) | 6.2% | 5.1% |
| Interquartile 75% (IQ3) | 11.7% | 9.0% |
| Interquartile Range (IQR) | 5.5% | 3.9% |
| Standard Deviation (Sample) | 11.8% | 3.8% |
| Standard Deviation (Population) | 11.6% | 3.8% |
Similar Demographics by Receiving Food Stamps
Demographics Similar to Immigrants from Saudi Arabia by Receiving Food Stamps
In terms of receiving food stamps, the demographic groups most similar to Immigrants from Saudi Arabia are Canadian (10.5%, a difference of 0.050%), Scotch-Irish (10.5%, a difference of 0.18%), Immigrants from Nepal (10.6%, a difference of 0.21%), Icelander (10.5%, a difference of 0.48%), and Assyrian/Chaldean/Syriac (10.6%, a difference of 0.54%).
| Demographics | Rating | Rank | Receiving Food Stamps |
| Carpatho Rusyns | 96.2 /100 | #108 | Exceptional 10.4% |
| Immigrants | Pakistan | 96.2 /100 | #109 | Exceptional 10.4% |
| Pakistanis | 95.9 /100 | #110 | Exceptional 10.4% |
| Romanians | 95.8 /100 | #111 | Exceptional 10.4% |
| Mongolians | 95.8 /100 | #112 | Exceptional 10.5% |
| Icelanders | 95.4 /100 | #113 | Exceptional 10.5% |
| Scotch-Irish | 95.1 /100 | #114 | Exceptional 10.5% |
| Immigrants | Saudi Arabia | 94.9 /100 | #115 | Exceptional 10.5% |
| Canadians | 94.8 /100 | #116 | Exceptional 10.5% |
| Immigrants | Nepal | 94.6 /100 | #117 | Exceptional 10.6% |
| Assyrians/Chaldeans/Syriacs | 94.1 /100 | #118 | Exceptional 10.6% |
| Immigrants | Poland | 93.9 /100 | #119 | Exceptional 10.6% |
| Ethiopians | 93.9 /100 | #120 | Exceptional 10.6% |
| Slavs | 93.8 /100 | #121 | Exceptional 10.6% |
| Sri Lankans | 93.7 /100 | #122 | Exceptional 10.6% |
Demographics Similar to Immigrants from Hong Kong by Receiving Food Stamps
In terms of receiving food stamps, the demographic groups most similar to Immigrants from Hong Kong are Latvian (9.1%, a difference of 0.33%), Luxembourger (9.1%, a difference of 0.48%), Danish (9.0%, a difference of 0.58%), Immigrants from Australia (9.2%, a difference of 0.73%), and Eastern European (9.2%, a difference of 0.84%).
| Demographics | Rating | Rank | Receiving Food Stamps |
| Cypriots | 99.9 /100 | #12 | Exceptional 8.9% |
| Bulgarians | 99.9 /100 | #13 | Exceptional 8.9% |
| Maltese | 99.9 /100 | #14 | Exceptional 8.9% |
| Norwegians | 99.9 /100 | #15 | Exceptional 9.0% |
| Immigrants | Japan | 99.9 /100 | #16 | Exceptional 9.0% |
| Immigrants | Scotland | 99.9 /100 | #17 | Exceptional 9.0% |
| Danes | 99.9 /100 | #18 | Exceptional 9.0% |
| Immigrants | Hong Kong | 99.8 /100 | #19 | Exceptional 9.1% |
| Latvians | 99.8 /100 | #20 | Exceptional 9.1% |
| Luxembourgers | 99.8 /100 | #21 | Exceptional 9.1% |
| Immigrants | Australia | 99.8 /100 | #22 | Exceptional 9.2% |
| Eastern Europeans | 99.8 /100 | #23 | Exceptional 9.2% |
| Immigrants | Northern Europe | 99.8 /100 | #24 | Exceptional 9.2% |
| Immigrants | Ireland | 99.8 /100 | #25 | Exceptional 9.2% |
| Swedes | 99.8 /100 | #26 | Exceptional 9.2% |