Subsaharan African vs Immigrants from Hong Kong Receiving Food Stamps
COMPARE
Subsaharan African
Immigrants from Hong Kong
Receiving Food Stamps
Receiving Food Stamps Comparison
Sub-Saharan Africans
Immigrants from Hong Kong
14.1%
RECEIVING FOOD STAMPS
0.3/ 100
METRIC RATING
255th/ 347
METRIC RANK
9.1%
RECEIVING FOOD STAMPS
99.8/ 100
METRIC RATING
19th/ 347
METRIC RANK
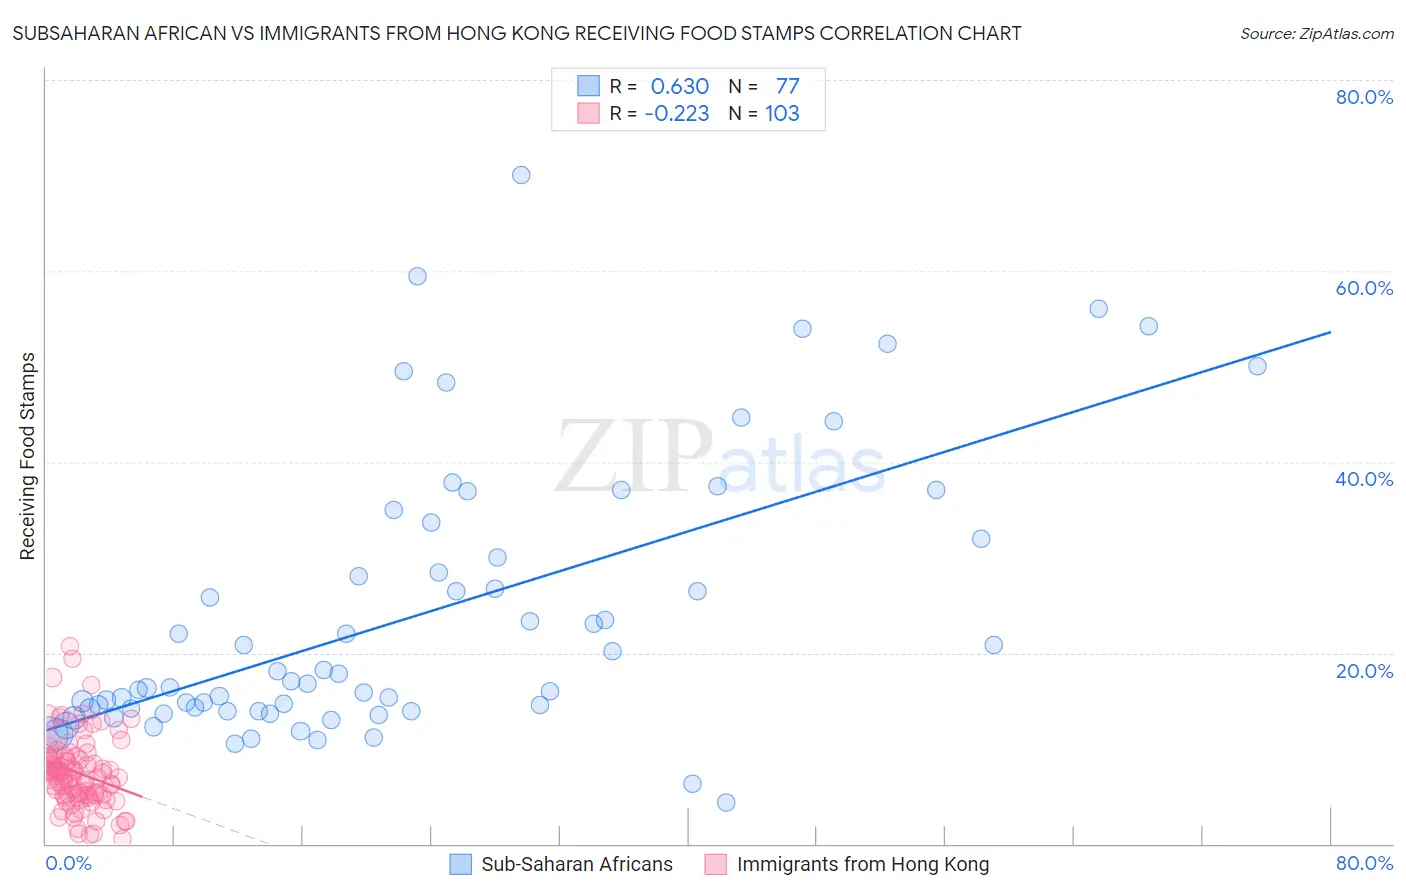
Subsaharan African vs Immigrants from Hong Kong Receiving Food Stamps Correlation Chart
The statistical analysis conducted on geographies consisting of 506,389,803 people shows a significant positive correlation between the proportion of Sub-Saharan Africans and percentage of population receiving government assistance and/or food stamps in the United States with a correlation coefficient (R) of 0.630 and weighted average of 14.1%. Similarly, the statistical analysis conducted on geographies consisting of 253,389,462 people shows a weak negative correlation between the proportion of Immigrants from Hong Kong and percentage of population receiving government assistance and/or food stamps in the United States with a correlation coefficient (R) of -0.223 and weighted average of 9.1%, a difference of 55.0%.
Receiving Food Stamps Correlation Summary
| Measurement | Subsaharan African | Immigrants from Hong Kong |
| Minimum | 4.3% | 0.50% |
| Maximum | 70.0% | 20.6% |
| Range | 65.7% | 20.1% |
| Mean | 23.8% | 7.4% |
| Median | 16.8% | 7.0% |
| Interquartile 25% (IQ1) | 13.9% | 5.1% |
| Interquartile 75% (IQ3) | 31.0% | 9.0% |
| Interquartile Range (IQR) | 17.1% | 3.9% |
| Standard Deviation (Sample) | 14.4% | 3.8% |
| Standard Deviation (Population) | 14.3% | 3.8% |
Similar Demographics by Receiving Food Stamps
Demographics Similar to Sub-Saharan Africans by Receiving Food Stamps
In terms of receiving food stamps, the demographic groups most similar to Sub-Saharan Africans are Marshallese (14.1%, a difference of 0.010%), Japanese (14.1%, a difference of 0.020%), Arapaho (14.1%, a difference of 0.12%), Immigrants from Ghana (14.1%, a difference of 0.20%), and Creek (14.1%, a difference of 0.33%).
| Demographics | Rating | Rank | Receiving Food Stamps |
| Immigrants | Laos | 0.7 /100 | #248 | Tragic 13.8% |
| Indonesians | 0.6 /100 | #249 | Tragic 13.9% |
| Immigrants | Cambodia | 0.5 /100 | #250 | Tragic 13.9% |
| Yaqui | 0.5 /100 | #251 | Tragic 13.9% |
| Ghanaians | 0.5 /100 | #252 | Tragic 14.0% |
| Spanish Americans | 0.4 /100 | #253 | Tragic 14.0% |
| Marshallese | 0.3 /100 | #254 | Tragic 14.1% |
| Sub-Saharan Africans | 0.3 /100 | #255 | Tragic 14.1% |
| Japanese | 0.3 /100 | #256 | Tragic 14.1% |
| Arapaho | 0.3 /100 | #257 | Tragic 14.1% |
| Immigrants | Ghana | 0.3 /100 | #258 | Tragic 14.1% |
| Creek | 0.3 /100 | #259 | Tragic 14.1% |
| Central Americans | 0.3 /100 | #260 | Tragic 14.1% |
| Immigrants | Congo | 0.3 /100 | #261 | Tragic 14.1% |
| Paiute | 0.2 /100 | #262 | Tragic 14.3% |
Demographics Similar to Immigrants from Hong Kong by Receiving Food Stamps
In terms of receiving food stamps, the demographic groups most similar to Immigrants from Hong Kong are Latvian (9.1%, a difference of 0.33%), Luxembourger (9.1%, a difference of 0.48%), Danish (9.0%, a difference of 0.58%), Immigrants from Australia (9.2%, a difference of 0.73%), and Eastern European (9.2%, a difference of 0.84%).
| Demographics | Rating | Rank | Receiving Food Stamps |
| Cypriots | 99.9 /100 | #12 | Exceptional 8.9% |
| Bulgarians | 99.9 /100 | #13 | Exceptional 8.9% |
| Maltese | 99.9 /100 | #14 | Exceptional 8.9% |
| Norwegians | 99.9 /100 | #15 | Exceptional 9.0% |
| Immigrants | Japan | 99.9 /100 | #16 | Exceptional 9.0% |
| Immigrants | Scotland | 99.9 /100 | #17 | Exceptional 9.0% |
| Danes | 99.9 /100 | #18 | Exceptional 9.0% |
| Immigrants | Hong Kong | 99.8 /100 | #19 | Exceptional 9.1% |
| Latvians | 99.8 /100 | #20 | Exceptional 9.1% |
| Luxembourgers | 99.8 /100 | #21 | Exceptional 9.1% |
| Immigrants | Australia | 99.8 /100 | #22 | Exceptional 9.2% |
| Eastern Europeans | 99.8 /100 | #23 | Exceptional 9.2% |
| Immigrants | Northern Europe | 99.8 /100 | #24 | Exceptional 9.2% |
| Immigrants | Ireland | 99.8 /100 | #25 | Exceptional 9.2% |
| Swedes | 99.8 /100 | #26 | Exceptional 9.2% |