Scotch-Irish vs Immigrants from China Receiving Food Stamps
COMPARE
Scotch-Irish
Immigrants from China
Receiving Food Stamps
Receiving Food Stamps Comparison
Scotch-Irish
Immigrants from China
10.5%
RECEIVING FOOD STAMPS
95.1/ 100
METRIC RATING
114th/ 347
METRIC RANK
9.6%
RECEIVING FOOD STAMPS
99.5/ 100
METRIC RATING
42nd/ 347
METRIC RANK
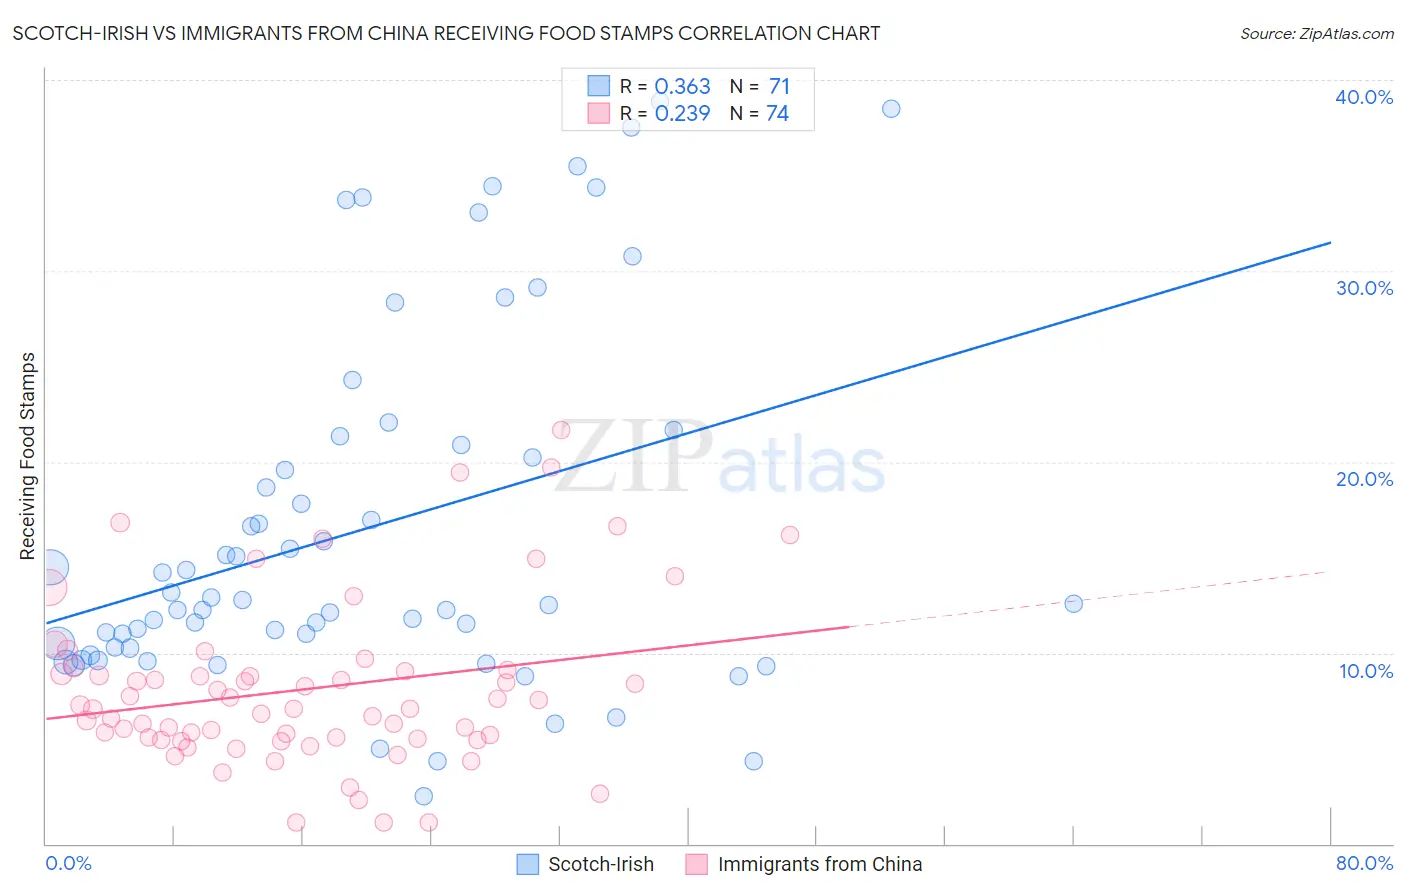
Scotch-Irish vs Immigrants from China Receiving Food Stamps Correlation Chart
The statistical analysis conducted on geographies consisting of 546,022,543 people shows a mild positive correlation between the proportion of Scotch-Irish and percentage of population receiving government assistance and/or food stamps in the United States with a correlation coefficient (R) of 0.363 and weighted average of 10.5%. Similarly, the statistical analysis conducted on geographies consisting of 454,770,317 people shows a weak positive correlation between the proportion of Immigrants from China and percentage of population receiving government assistance and/or food stamps in the United States with a correlation coefficient (R) of 0.239 and weighted average of 9.6%, a difference of 10.0%.
Receiving Food Stamps Correlation Summary
| Measurement | Scotch-Irish | Immigrants from China |
| Minimum | 2.5% | 1.1% |
| Maximum | 38.9% | 21.7% |
| Range | 36.4% | 20.6% |
| Mean | 16.4% | 8.1% |
| Median | 12.6% | 7.1% |
| Interquartile 25% (IQ1) | 10.2% | 5.5% |
| Interquartile 75% (IQ3) | 20.9% | 9.1% |
| Interquartile Range (IQR) | 10.7% | 3.6% |
| Standard Deviation (Sample) | 9.3% | 4.3% |
| Standard Deviation (Population) | 9.2% | 4.3% |
Similar Demographics by Receiving Food Stamps
Demographics Similar to Scotch-Irish by Receiving Food Stamps
In terms of receiving food stamps, the demographic groups most similar to Scotch-Irish are Immigrants from Saudi Arabia (10.5%, a difference of 0.18%), Canadian (10.5%, a difference of 0.22%), Icelander (10.5%, a difference of 0.30%), Immigrants from Nepal (10.6%, a difference of 0.39%), and Mongolian (10.5%, a difference of 0.68%).
| Demographics | Rating | Rank | Receiving Food Stamps |
| Koreans | 96.3 /100 | #107 | Exceptional 10.4% |
| Carpatho Rusyns | 96.2 /100 | #108 | Exceptional 10.4% |
| Immigrants | Pakistan | 96.2 /100 | #109 | Exceptional 10.4% |
| Pakistanis | 95.9 /100 | #110 | Exceptional 10.4% |
| Romanians | 95.8 /100 | #111 | Exceptional 10.4% |
| Mongolians | 95.8 /100 | #112 | Exceptional 10.5% |
| Icelanders | 95.4 /100 | #113 | Exceptional 10.5% |
| Scotch-Irish | 95.1 /100 | #114 | Exceptional 10.5% |
| Immigrants | Saudi Arabia | 94.9 /100 | #115 | Exceptional 10.5% |
| Canadians | 94.8 /100 | #116 | Exceptional 10.5% |
| Immigrants | Nepal | 94.6 /100 | #117 | Exceptional 10.6% |
| Assyrians/Chaldeans/Syriacs | 94.1 /100 | #118 | Exceptional 10.6% |
| Immigrants | Poland | 93.9 /100 | #119 | Exceptional 10.6% |
| Ethiopians | 93.9 /100 | #120 | Exceptional 10.6% |
| Slavs | 93.8 /100 | #121 | Exceptional 10.6% |
Demographics Similar to Immigrants from China by Receiving Food Stamps
In terms of receiving food stamps, the demographic groups most similar to Immigrants from China are Cambodian (9.5%, a difference of 0.25%), Croatian (9.6%, a difference of 0.30%), Immigrants from Netherlands (9.5%, a difference of 0.42%), Immigrants from Bolivia (9.5%, a difference of 0.43%), and Immigrants from Sri Lanka (9.5%, a difference of 0.44%).
| Demographics | Rating | Rank | Receiving Food Stamps |
| Immigrants | Austria | 99.6 /100 | #35 | Exceptional 9.5% |
| Estonians | 99.6 /100 | #36 | Exceptional 9.5% |
| Europeans | 99.6 /100 | #37 | Exceptional 9.5% |
| Immigrants | Sri Lanka | 99.5 /100 | #38 | Exceptional 9.5% |
| Immigrants | Bolivia | 99.5 /100 | #39 | Exceptional 9.5% |
| Immigrants | Netherlands | 99.5 /100 | #40 | Exceptional 9.5% |
| Cambodians | 99.5 /100 | #41 | Exceptional 9.5% |
| Immigrants | China | 99.5 /100 | #42 | Exceptional 9.6% |
| Croatians | 99.5 /100 | #43 | Exceptional 9.6% |
| Immigrants | Denmark | 99.4 /100 | #44 | Exceptional 9.6% |
| Immigrants | Belgium | 99.4 /100 | #45 | Exceptional 9.6% |
| Australians | 99.4 /100 | #46 | Exceptional 9.6% |
| Indians (Asian) | 99.4 /100 | #47 | Exceptional 9.6% |
| Russians | 99.4 /100 | #48 | Exceptional 9.6% |
| Immigrants | Czechoslovakia | 99.4 /100 | #49 | Exceptional 9.6% |