Scotch-Irish vs Immigrants from Haiti Receiving Food Stamps
COMPARE
Scotch-Irish
Immigrants from Haiti
Receiving Food Stamps
Receiving Food Stamps Comparison
Scotch-Irish
Immigrants from Haiti
10.5%
RECEIVING FOOD STAMPS
95.1/ 100
METRIC RATING
114th/ 347
METRIC RANK
18.2%
RECEIVING FOOD STAMPS
0.0/ 100
METRIC RATING
325th/ 347
METRIC RANK
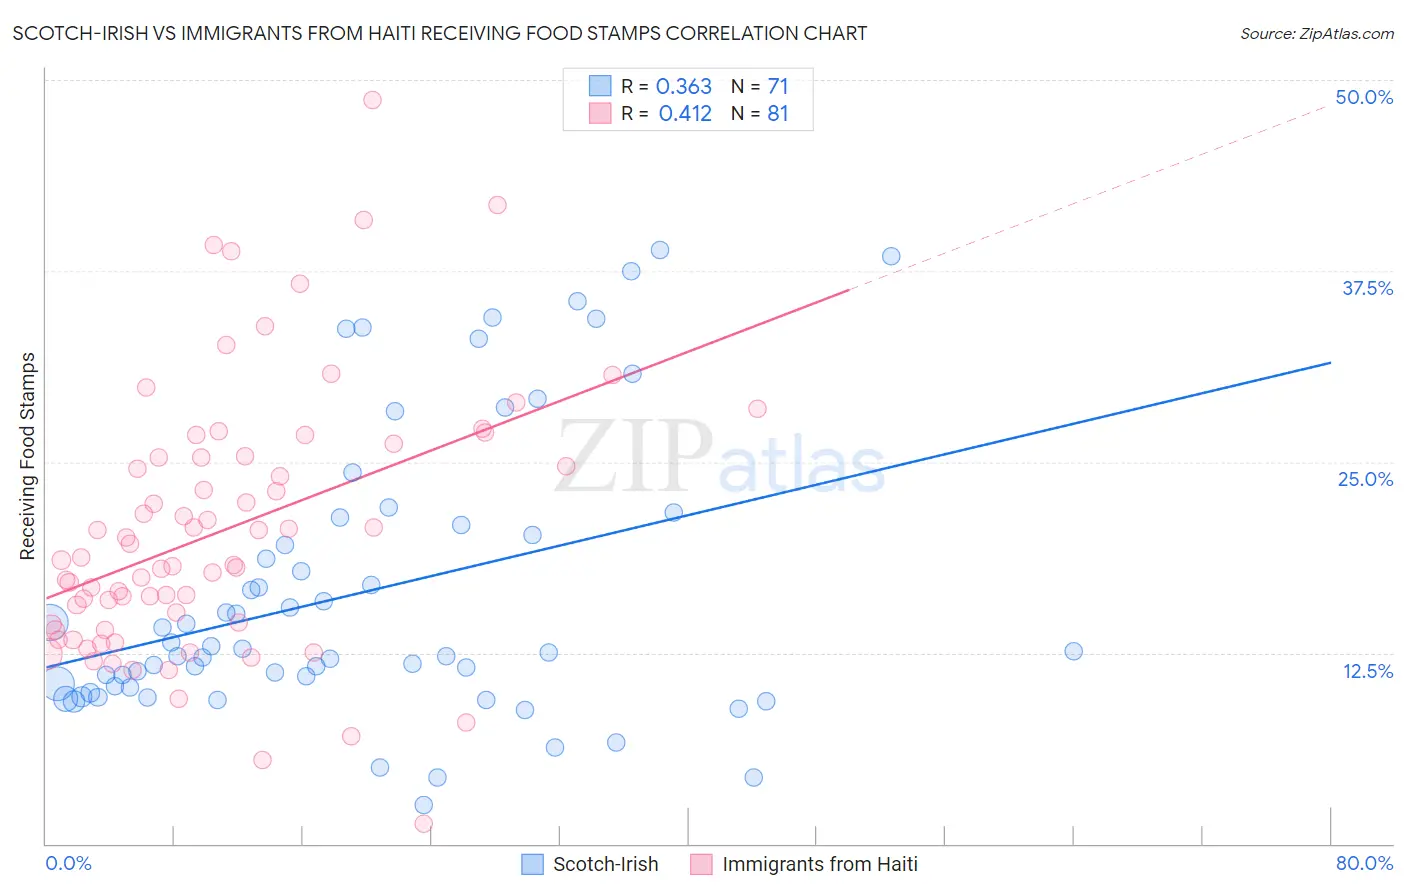
Scotch-Irish vs Immigrants from Haiti Receiving Food Stamps Correlation Chart
The statistical analysis conducted on geographies consisting of 546,022,543 people shows a mild positive correlation between the proportion of Scotch-Irish and percentage of population receiving government assistance and/or food stamps in the United States with a correlation coefficient (R) of 0.363 and weighted average of 10.5%. Similarly, the statistical analysis conducted on geographies consisting of 225,016,016 people shows a moderate positive correlation between the proportion of Immigrants from Haiti and percentage of population receiving government assistance and/or food stamps in the United States with a correlation coefficient (R) of 0.412 and weighted average of 18.2%, a difference of 73.0%.
Receiving Food Stamps Correlation Summary
| Measurement | Scotch-Irish | Immigrants from Haiti |
| Minimum | 2.5% | 1.3% |
| Maximum | 38.9% | 48.7% |
| Range | 36.4% | 47.4% |
| Mean | 16.4% | 20.5% |
| Median | 12.6% | 18.6% |
| Interquartile 25% (IQ1) | 10.2% | 14.2% |
| Interquartile 75% (IQ3) | 20.9% | 25.4% |
| Interquartile Range (IQR) | 10.7% | 11.2% |
| Standard Deviation (Sample) | 9.3% | 8.7% |
| Standard Deviation (Population) | 9.2% | 8.7% |
Similar Demographics by Receiving Food Stamps
Demographics Similar to Scotch-Irish by Receiving Food Stamps
In terms of receiving food stamps, the demographic groups most similar to Scotch-Irish are Immigrants from Saudi Arabia (10.5%, a difference of 0.18%), Canadian (10.5%, a difference of 0.22%), Icelander (10.5%, a difference of 0.30%), Immigrants from Nepal (10.6%, a difference of 0.39%), and Mongolian (10.5%, a difference of 0.68%).
| Demographics | Rating | Rank | Receiving Food Stamps |
| Koreans | 96.3 /100 | #107 | Exceptional 10.4% |
| Carpatho Rusyns | 96.2 /100 | #108 | Exceptional 10.4% |
| Immigrants | Pakistan | 96.2 /100 | #109 | Exceptional 10.4% |
| Pakistanis | 95.9 /100 | #110 | Exceptional 10.4% |
| Romanians | 95.8 /100 | #111 | Exceptional 10.4% |
| Mongolians | 95.8 /100 | #112 | Exceptional 10.5% |
| Icelanders | 95.4 /100 | #113 | Exceptional 10.5% |
| Scotch-Irish | 95.1 /100 | #114 | Exceptional 10.5% |
| Immigrants | Saudi Arabia | 94.9 /100 | #115 | Exceptional 10.5% |
| Canadians | 94.8 /100 | #116 | Exceptional 10.5% |
| Immigrants | Nepal | 94.6 /100 | #117 | Exceptional 10.6% |
| Assyrians/Chaldeans/Syriacs | 94.1 /100 | #118 | Exceptional 10.6% |
| Immigrants | Poland | 93.9 /100 | #119 | Exceptional 10.6% |
| Ethiopians | 93.9 /100 | #120 | Exceptional 10.6% |
| Slavs | 93.8 /100 | #121 | Exceptional 10.6% |
Demographics Similar to Immigrants from Haiti by Receiving Food Stamps
In terms of receiving food stamps, the demographic groups most similar to Immigrants from Haiti are Cuban (18.2%, a difference of 0.11%), Apache (18.3%, a difference of 0.42%), Colville (18.3%, a difference of 0.63%), Immigrants from Dominica (18.4%, a difference of 1.1%), and British West Indian (17.9%, a difference of 1.8%).
| Demographics | Rating | Rank | Receiving Food Stamps |
| Menominee | 0.0 /100 | #318 | Tragic 17.2% |
| Immigrants | St. Vincent and the Grenadines | 0.0 /100 | #319 | Tragic 17.2% |
| Immigrants | Nicaragua | 0.0 /100 | #320 | Tragic 17.2% |
| Natives/Alaskans | 0.0 /100 | #321 | Tragic 17.3% |
| Immigrants | Grenada | 0.0 /100 | #322 | Tragic 17.8% |
| Haitians | 0.0 /100 | #323 | Tragic 17.8% |
| British West Indians | 0.0 /100 | #324 | Tragic 17.9% |
| Immigrants | Haiti | 0.0 /100 | #325 | Tragic 18.2% |
| Cubans | 0.0 /100 | #326 | Tragic 18.2% |
| Apache | 0.0 /100 | #327 | Tragic 18.3% |
| Colville | 0.0 /100 | #328 | Tragic 18.3% |
| Immigrants | Dominica | 0.0 /100 | #329 | Tragic 18.4% |
| Pima | 0.0 /100 | #330 | Tragic 19.0% |
| Immigrants | Caribbean | 0.0 /100 | #331 | Tragic 19.6% |
| Pueblo | 0.0 /100 | #332 | Tragic 19.9% |