Immigrants from Syria vs Immigrants from Hong Kong Receiving Food Stamps
COMPARE
Immigrants from Syria
Immigrants from Hong Kong
Receiving Food Stamps
Receiving Food Stamps Comparison
Immigrants from Syria
Immigrants from Hong Kong
11.7%
RECEIVING FOOD STAMPS
53.4/ 100
METRIC RATING
173rd/ 347
METRIC RANK
9.1%
RECEIVING FOOD STAMPS
99.8/ 100
METRIC RATING
19th/ 347
METRIC RANK
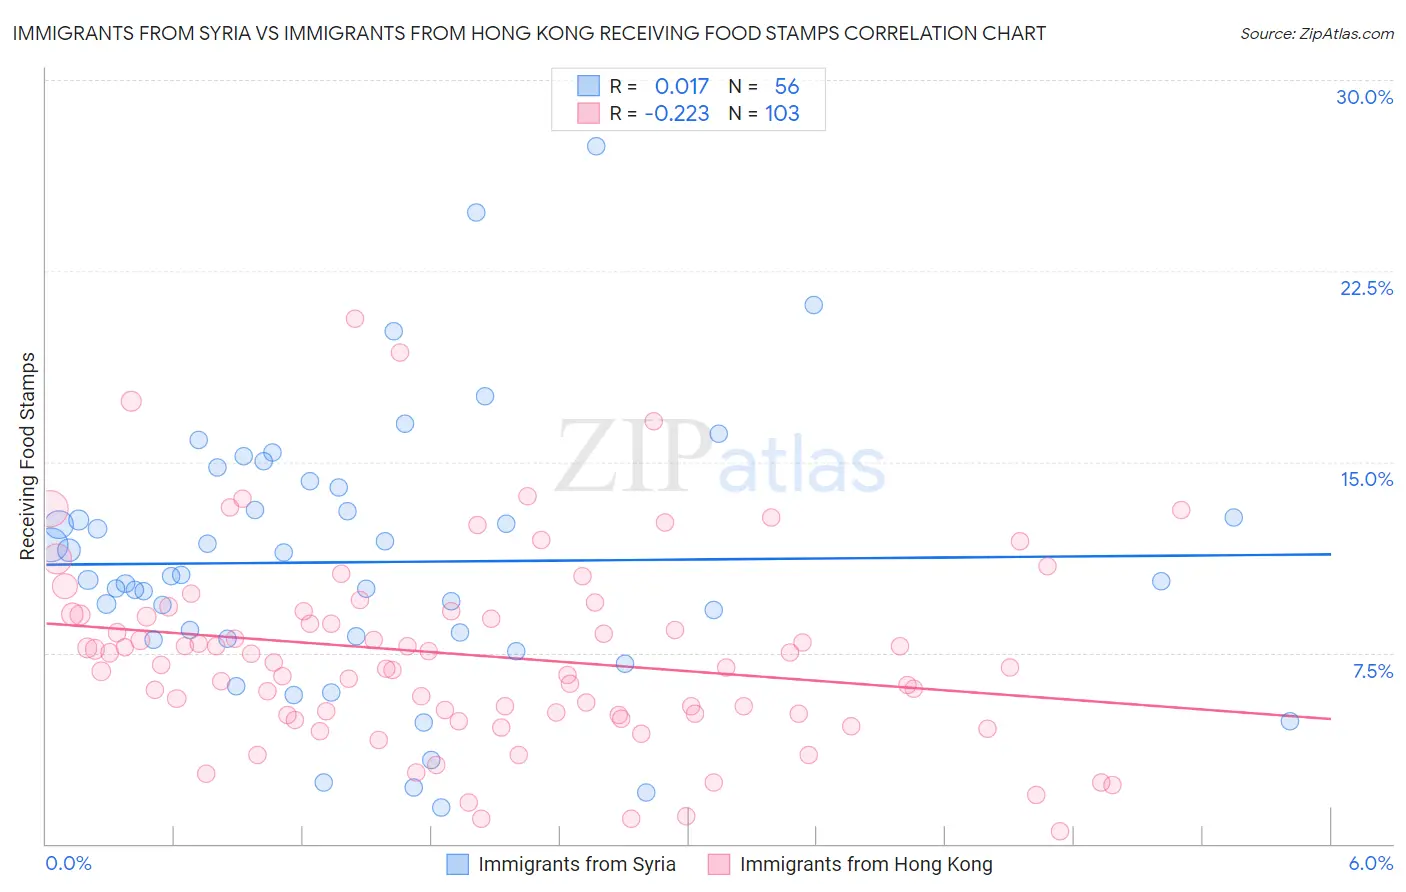
Immigrants from Syria vs Immigrants from Hong Kong Receiving Food Stamps Correlation Chart
The statistical analysis conducted on geographies consisting of 173,879,685 people shows no correlation between the proportion of Immigrants from Syria and percentage of population receiving government assistance and/or food stamps in the United States with a correlation coefficient (R) of 0.017 and weighted average of 11.7%. Similarly, the statistical analysis conducted on geographies consisting of 253,389,462 people shows a weak negative correlation between the proportion of Immigrants from Hong Kong and percentage of population receiving government assistance and/or food stamps in the United States with a correlation coefficient (R) of -0.223 and weighted average of 9.1%, a difference of 28.5%.
Receiving Food Stamps Correlation Summary
| Measurement | Immigrants from Syria | Immigrants from Hong Kong |
| Minimum | 1.4% | 0.50% |
| Maximum | 27.4% | 20.6% |
| Range | 26.0% | 20.1% |
| Mean | 11.1% | 7.4% |
| Median | 10.4% | 7.0% |
| Interquartile 25% (IQ1) | 8.1% | 5.1% |
| Interquartile 75% (IQ3) | 13.5% | 9.0% |
| Interquartile Range (IQR) | 5.5% | 3.9% |
| Standard Deviation (Sample) | 5.2% | 3.8% |
| Standard Deviation (Population) | 5.2% | 3.8% |
Similar Demographics by Receiving Food Stamps
Demographics Similar to Immigrants from Syria by Receiving Food Stamps
In terms of receiving food stamps, the demographic groups most similar to Immigrants from Syria are Guamanian/Chamorro (11.7%, a difference of 0.11%), Immigrants from Western Asia (11.6%, a difference of 0.42%), Immigrants from Eritrea (11.7%, a difference of 0.48%), Osage (11.7%, a difference of 0.51%), and Peruvian (11.7%, a difference of 0.58%).
| Demographics | Rating | Rank | Receiving Food Stamps |
| Immigrants | Belarus | 62.8 /100 | #166 | Good 11.5% |
| Kenyans | 60.2 /100 | #167 | Good 11.6% |
| Tlingit-Haida | 59.1 /100 | #168 | Average 11.6% |
| Immigrants | Eastern Africa | 58.3 /100 | #169 | Average 11.6% |
| Costa Ricans | 57.9 /100 | #170 | Average 11.6% |
| Immigrants | Western Asia | 56.4 /100 | #171 | Average 11.6% |
| Guamanians/Chamorros | 54.2 /100 | #172 | Average 11.7% |
| Immigrants | Syria | 53.4 /100 | #173 | Average 11.7% |
| Immigrants | Eritrea | 50.0 /100 | #174 | Average 11.7% |
| Osage | 49.8 /100 | #175 | Average 11.7% |
| Peruvians | 49.3 /100 | #176 | Average 11.7% |
| Immigrants | Ukraine | 48.4 /100 | #177 | Average 11.8% |
| German Russians | 48.1 /100 | #178 | Average 11.8% |
| Immigrants | Kenya | 46.4 /100 | #179 | Average 11.8% |
| Uruguayans | 44.8 /100 | #180 | Average 11.8% |
Demographics Similar to Immigrants from Hong Kong by Receiving Food Stamps
In terms of receiving food stamps, the demographic groups most similar to Immigrants from Hong Kong are Latvian (9.1%, a difference of 0.33%), Luxembourger (9.1%, a difference of 0.48%), Danish (9.0%, a difference of 0.58%), Immigrants from Australia (9.2%, a difference of 0.73%), and Eastern European (9.2%, a difference of 0.84%).
| Demographics | Rating | Rank | Receiving Food Stamps |
| Cypriots | 99.9 /100 | #12 | Exceptional 8.9% |
| Bulgarians | 99.9 /100 | #13 | Exceptional 8.9% |
| Maltese | 99.9 /100 | #14 | Exceptional 8.9% |
| Norwegians | 99.9 /100 | #15 | Exceptional 9.0% |
| Immigrants | Japan | 99.9 /100 | #16 | Exceptional 9.0% |
| Immigrants | Scotland | 99.9 /100 | #17 | Exceptional 9.0% |
| Danes | 99.9 /100 | #18 | Exceptional 9.0% |
| Immigrants | Hong Kong | 99.8 /100 | #19 | Exceptional 9.1% |
| Latvians | 99.8 /100 | #20 | Exceptional 9.1% |
| Luxembourgers | 99.8 /100 | #21 | Exceptional 9.1% |
| Immigrants | Australia | 99.8 /100 | #22 | Exceptional 9.2% |
| Eastern Europeans | 99.8 /100 | #23 | Exceptional 9.2% |
| Immigrants | Northern Europe | 99.8 /100 | #24 | Exceptional 9.2% |
| Immigrants | Ireland | 99.8 /100 | #25 | Exceptional 9.2% |
| Swedes | 99.8 /100 | #26 | Exceptional 9.2% |