Scotch-Irish vs Japanese Receiving Food Stamps
COMPARE
Scotch-Irish
Japanese
Receiving Food Stamps
Receiving Food Stamps Comparison
Scotch-Irish
Japanese
10.5%
RECEIVING FOOD STAMPS
95.1/ 100
METRIC RATING
114th/ 347
METRIC RANK
14.1%
RECEIVING FOOD STAMPS
0.3/ 100
METRIC RATING
256th/ 347
METRIC RANK
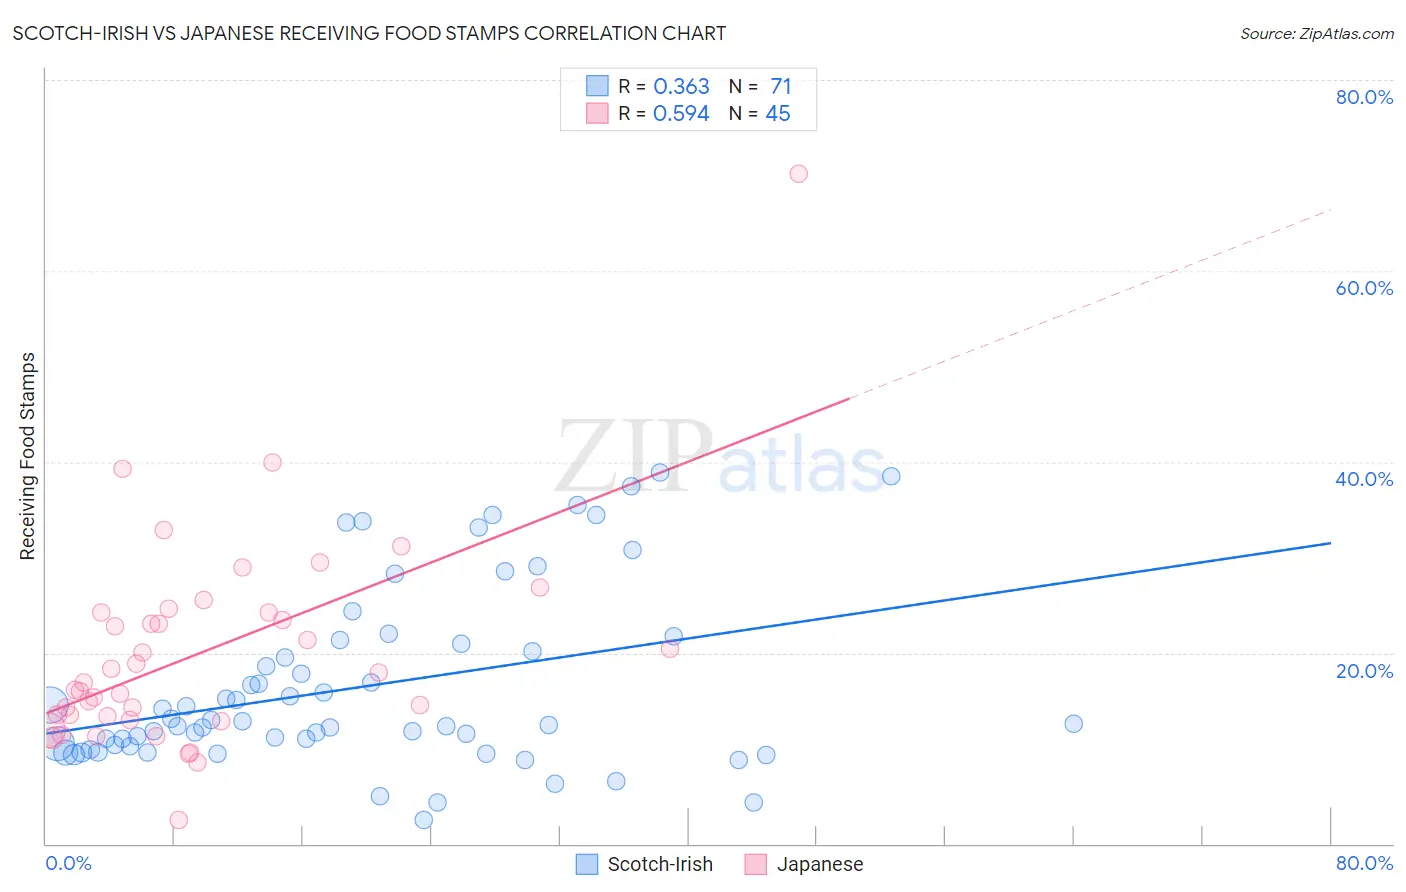
Scotch-Irish vs Japanese Receiving Food Stamps Correlation Chart
The statistical analysis conducted on geographies consisting of 546,022,543 people shows a mild positive correlation between the proportion of Scotch-Irish and percentage of population receiving government assistance and/or food stamps in the United States with a correlation coefficient (R) of 0.363 and weighted average of 10.5%. Similarly, the statistical analysis conducted on geographies consisting of 248,870,971 people shows a substantial positive correlation between the proportion of Japanese and percentage of population receiving government assistance and/or food stamps in the United States with a correlation coefficient (R) of 0.594 and weighted average of 14.1%, a difference of 33.9%.
Receiving Food Stamps Correlation Summary
| Measurement | Scotch-Irish | Japanese |
| Minimum | 2.5% | 2.5% |
| Maximum | 38.9% | 70.2% |
| Range | 36.4% | 67.7% |
| Mean | 16.4% | 19.9% |
| Median | 12.6% | 16.8% |
| Interquartile 25% (IQ1) | 10.2% | 13.1% |
| Interquartile 75% (IQ3) | 20.9% | 24.2% |
| Interquartile Range (IQR) | 10.7% | 11.1% |
| Standard Deviation (Sample) | 9.3% | 11.1% |
| Standard Deviation (Population) | 9.2% | 10.9% |
Similar Demographics by Receiving Food Stamps
Demographics Similar to Scotch-Irish by Receiving Food Stamps
In terms of receiving food stamps, the demographic groups most similar to Scotch-Irish are Immigrants from Saudi Arabia (10.5%, a difference of 0.18%), Canadian (10.5%, a difference of 0.22%), Icelander (10.5%, a difference of 0.30%), Immigrants from Nepal (10.6%, a difference of 0.39%), and Mongolian (10.5%, a difference of 0.68%).
| Demographics | Rating | Rank | Receiving Food Stamps |
| Koreans | 96.3 /100 | #107 | Exceptional 10.4% |
| Carpatho Rusyns | 96.2 /100 | #108 | Exceptional 10.4% |
| Immigrants | Pakistan | 96.2 /100 | #109 | Exceptional 10.4% |
| Pakistanis | 95.9 /100 | #110 | Exceptional 10.4% |
| Romanians | 95.8 /100 | #111 | Exceptional 10.4% |
| Mongolians | 95.8 /100 | #112 | Exceptional 10.5% |
| Icelanders | 95.4 /100 | #113 | Exceptional 10.5% |
| Scotch-Irish | 95.1 /100 | #114 | Exceptional 10.5% |
| Immigrants | Saudi Arabia | 94.9 /100 | #115 | Exceptional 10.5% |
| Canadians | 94.8 /100 | #116 | Exceptional 10.5% |
| Immigrants | Nepal | 94.6 /100 | #117 | Exceptional 10.6% |
| Assyrians/Chaldeans/Syriacs | 94.1 /100 | #118 | Exceptional 10.6% |
| Immigrants | Poland | 93.9 /100 | #119 | Exceptional 10.6% |
| Ethiopians | 93.9 /100 | #120 | Exceptional 10.6% |
| Slavs | 93.8 /100 | #121 | Exceptional 10.6% |
Demographics Similar to Japanese by Receiving Food Stamps
In terms of receiving food stamps, the demographic groups most similar to Japanese are Subsaharan African (14.1%, a difference of 0.020%), Marshallese (14.1%, a difference of 0.030%), Arapaho (14.1%, a difference of 0.10%), Immigrants from Ghana (14.1%, a difference of 0.18%), and Creek (14.1%, a difference of 0.30%).
| Demographics | Rating | Rank | Receiving Food Stamps |
| Indonesians | 0.6 /100 | #249 | Tragic 13.9% |
| Immigrants | Cambodia | 0.5 /100 | #250 | Tragic 13.9% |
| Yaqui | 0.5 /100 | #251 | Tragic 13.9% |
| Ghanaians | 0.5 /100 | #252 | Tragic 14.0% |
| Spanish Americans | 0.4 /100 | #253 | Tragic 14.0% |
| Marshallese | 0.3 /100 | #254 | Tragic 14.1% |
| Sub-Saharan Africans | 0.3 /100 | #255 | Tragic 14.1% |
| Japanese | 0.3 /100 | #256 | Tragic 14.1% |
| Arapaho | 0.3 /100 | #257 | Tragic 14.1% |
| Immigrants | Ghana | 0.3 /100 | #258 | Tragic 14.1% |
| Creek | 0.3 /100 | #259 | Tragic 14.1% |
| Central Americans | 0.3 /100 | #260 | Tragic 14.1% |
| Immigrants | Congo | 0.3 /100 | #261 | Tragic 14.1% |
| Paiute | 0.2 /100 | #262 | Tragic 14.3% |
| Immigrants | Portugal | 0.2 /100 | #263 | Tragic 14.3% |