Scotch-Irish vs Immigrants from China Unemployment Among Women with Children Under 6 years
COMPARE
Scotch-Irish
Immigrants from China
Unemployment Among Women with Children Under 6 years
Unemployment Among Women with Children Under 6 years Comparison
Scotch-Irish
Immigrants from China
8.4%
UNEMPLOYMENT AMONG WOMEN WITH CHILDREN UNDER 6 YEARS
0.3/ 100
METRIC RATING
263rd/ 347
METRIC RANK
6.2%
UNEMPLOYMENT AMONG WOMEN WITH CHILDREN UNDER 6 YEARS
100.0/ 100
METRIC RATING
10th/ 347
METRIC RANK
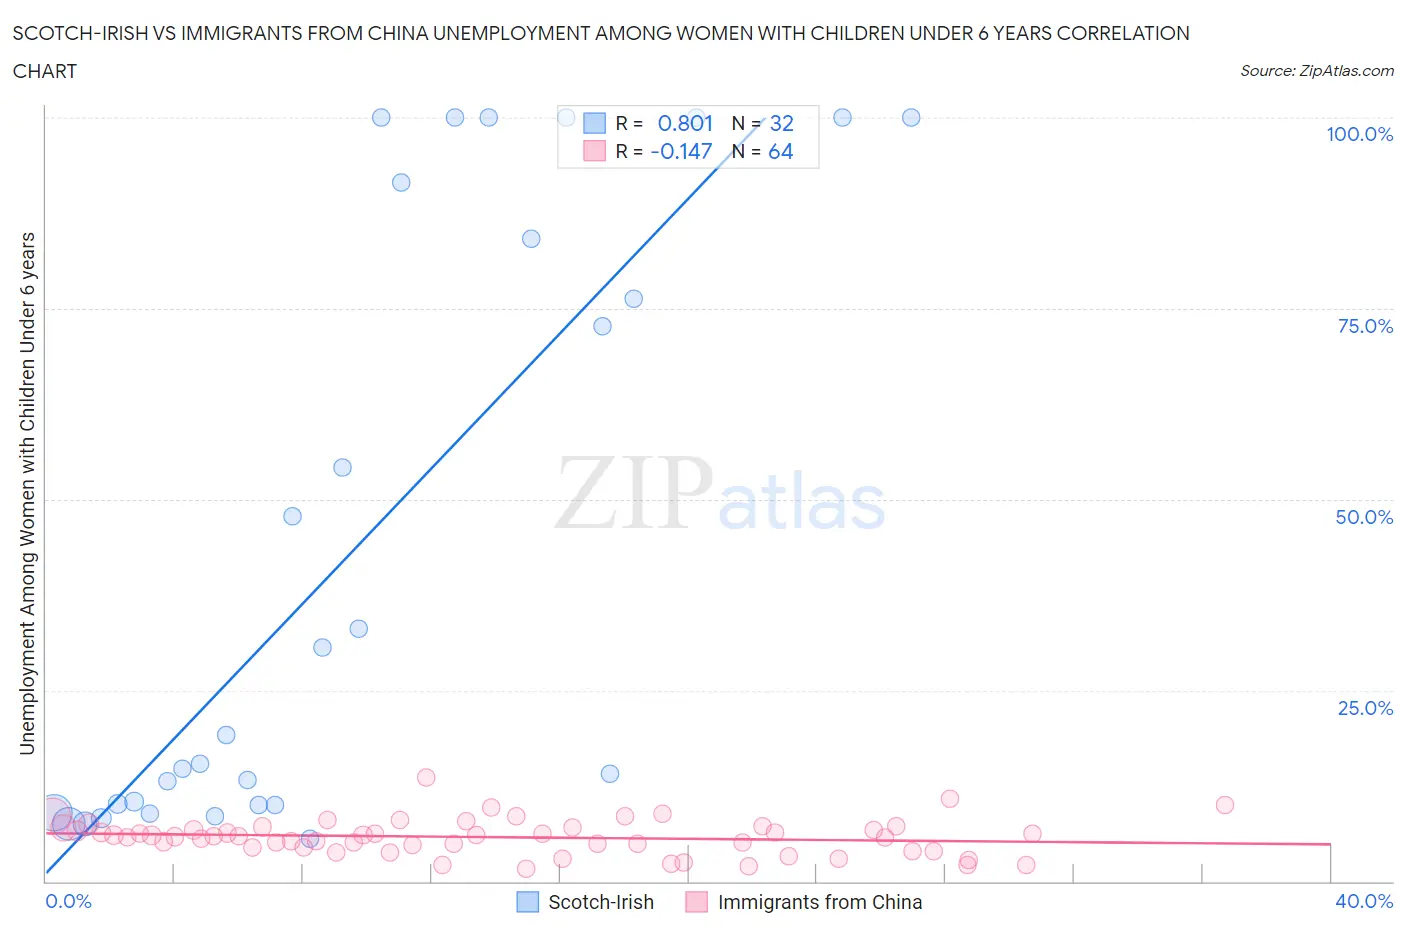
Scotch-Irish vs Immigrants from China Unemployment Among Women with Children Under 6 years Correlation Chart
The statistical analysis conducted on geographies consisting of 365,350,902 people shows a very strong positive correlation between the proportion of Scotch-Irish and unemployment rate among women with children under the age of 6 in the United States with a correlation coefficient (R) of 0.801 and weighted average of 8.4%. Similarly, the statistical analysis conducted on geographies consisting of 334,785,939 people shows a poor negative correlation between the proportion of Immigrants from China and unemployment rate among women with children under the age of 6 in the United States with a correlation coefficient (R) of -0.147 and weighted average of 6.2%, a difference of 34.8%.
Unemployment Among Women with Children Under 6 years Correlation Summary
| Measurement | Scotch-Irish | Immigrants from China |
| Minimum | 5.6% | 1.7% |
| Maximum | 100.0% | 13.5% |
| Range | 94.4% | 11.8% |
| Mean | 43.0% | 5.8% |
| Median | 17.2% | 5.9% |
| Interquartile 25% (IQ1) | 10.0% | 4.5% |
| Interquartile 75% (IQ3) | 87.8% | 7.0% |
| Interquartile Range (IQR) | 77.9% | 2.5% |
| Standard Deviation (Sample) | 38.9% | 2.3% |
| Standard Deviation (Population) | 38.3% | 2.3% |
Similar Demographics by Unemployment Among Women with Children Under 6 years
Demographics Similar to Scotch-Irish by Unemployment Among Women with Children Under 6 years
In terms of unemployment among women with children under 6 years, the demographic groups most similar to Scotch-Irish are Honduran (8.4%, a difference of 0.020%), West Indian (8.4%, a difference of 0.030%), Immigrants from Liberia (8.4%, a difference of 0.040%), French Canadian (8.4%, a difference of 0.070%), and Immigrants from Honduras (8.4%, a difference of 0.070%).
| Demographics | Rating | Rank | Unemployment Among Women with Children Under 6 years |
| Celtics | 0.6 /100 | #256 | Tragic 8.3% |
| British West Indians | 0.5 /100 | #257 | Tragic 8.3% |
| Immigrants | Ghana | 0.5 /100 | #258 | Tragic 8.3% |
| Barbadians | 0.4 /100 | #259 | Tragic 8.3% |
| Whites/Caucasians | 0.3 /100 | #260 | Tragic 8.4% |
| Immigrants | Liberia | 0.3 /100 | #261 | Tragic 8.4% |
| West Indians | 0.3 /100 | #262 | Tragic 8.4% |
| Scotch-Irish | 0.3 /100 | #263 | Tragic 8.4% |
| Hondurans | 0.3 /100 | #264 | Tragic 8.4% |
| French Canadians | 0.3 /100 | #265 | Tragic 8.4% |
| Immigrants | Honduras | 0.3 /100 | #266 | Tragic 8.4% |
| Belizeans | 0.2 /100 | #267 | Tragic 8.4% |
| Sub-Saharan Africans | 0.2 /100 | #268 | Tragic 8.4% |
| Immigrants | Haiti | 0.2 /100 | #269 | Tragic 8.4% |
| Immigrants | Senegal | 0.2 /100 | #270 | Tragic 8.5% |
Demographics Similar to Immigrants from China by Unemployment Among Women with Children Under 6 years
In terms of unemployment among women with children under 6 years, the demographic groups most similar to Immigrants from China are Indian (Asian) (6.3%, a difference of 1.1%), Immigrants from Singapore (6.3%, a difference of 1.2%), Immigrants from Eastern Asia (6.3%, a difference of 1.2%), Filipino (6.1%, a difference of 1.5%), and Immigrants from Bulgaria (6.3%, a difference of 1.5%).
| Demographics | Rating | Rank | Unemployment Among Women with Children Under 6 years |
| Okinawans | 100.0 /100 | #3 | Exceptional 5.8% |
| Cambodians | 100.0 /100 | #4 | Exceptional 5.9% |
| Cape Verdeans | 100.0 /100 | #5 | Exceptional 5.9% |
| Immigrants | Taiwan | 100.0 /100 | #6 | Exceptional 6.0% |
| Taiwanese | 100.0 /100 | #7 | Exceptional 6.1% |
| Immigrants | India | 100.0 /100 | #8 | Exceptional 6.1% |
| Filipinos | 100.0 /100 | #9 | Exceptional 6.1% |
| Immigrants | China | 100.0 /100 | #10 | Exceptional 6.2% |
| Indians (Asian) | 100.0 /100 | #11 | Exceptional 6.3% |
| Immigrants | Singapore | 100.0 /100 | #12 | Exceptional 6.3% |
| Immigrants | Eastern Asia | 100.0 /100 | #13 | Exceptional 6.3% |
| Immigrants | Bulgaria | 100.0 /100 | #14 | Exceptional 6.3% |
| Thais | 100.0 /100 | #15 | Exceptional 6.3% |
| Immigrants | Uzbekistan | 100.0 /100 | #16 | Exceptional 6.3% |
| Immigrants | Malaysia | 100.0 /100 | #17 | Exceptional 6.4% |