Scotch-Irish vs Immigrants from China Single Male Poverty
COMPARE
Scotch-Irish
Immigrants from China
Single Male Poverty
Single Male Poverty Comparison
Scotch-Irish
Immigrants from China
14.7%
SINGLE MALE POVERTY
0.0/ 100
METRIC RATING
295th/ 347
METRIC RANK
11.4%
SINGLE MALE POVERTY
100.0/ 100
METRIC RATING
27th/ 347
METRIC RANK
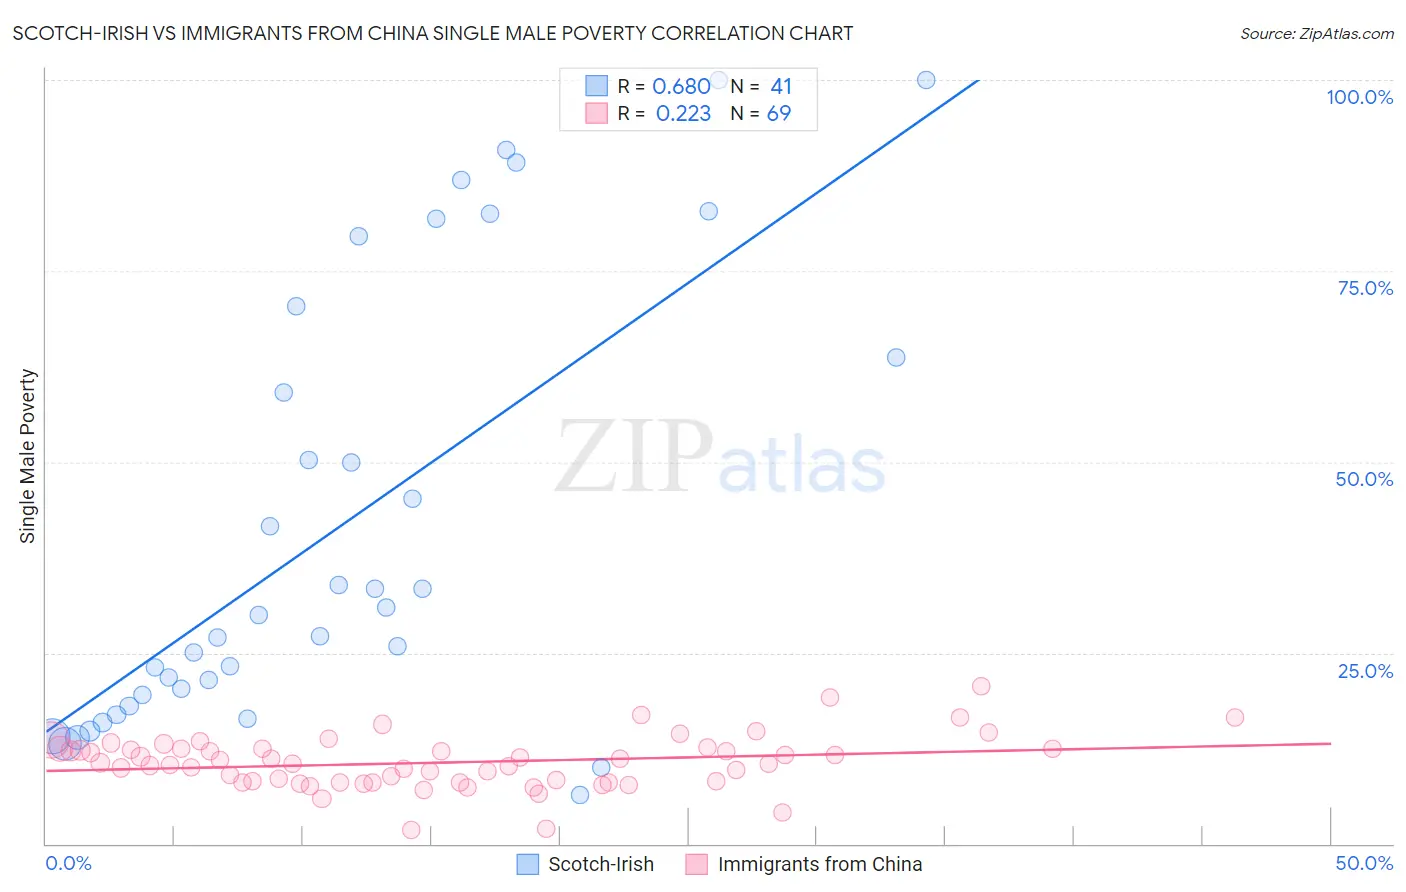
Scotch-Irish vs Immigrants from China Single Male Poverty Correlation Chart
The statistical analysis conducted on geographies consisting of 456,240,238 people shows a significant positive correlation between the proportion of Scotch-Irish and poverty level among single males in the United States with a correlation coefficient (R) of 0.680 and weighted average of 14.7%. Similarly, the statistical analysis conducted on geographies consisting of 395,740,575 people shows a weak positive correlation between the proportion of Immigrants from China and poverty level among single males in the United States with a correlation coefficient (R) of 0.223 and weighted average of 11.4%, a difference of 29.0%.
Single Male Poverty Correlation Summary
| Measurement | Scotch-Irish | Immigrants from China |
| Minimum | 6.4% | 1.7% |
| Maximum | 100.0% | 20.6% |
| Range | 93.6% | 18.8% |
| Mean | 41.7% | 10.6% |
| Median | 30.0% | 10.5% |
| Interquartile 25% (IQ1) | 18.7% | 8.0% |
| Interquartile 75% (IQ3) | 67.0% | 12.4% |
| Interquartile Range (IQR) | 48.3% | 4.4% |
| Standard Deviation (Sample) | 28.9% | 3.4% |
| Standard Deviation (Population) | 28.5% | 3.4% |
Similar Demographics by Single Male Poverty
Demographics Similar to Scotch-Irish by Single Male Poverty
In terms of single male poverty, the demographic groups most similar to Scotch-Irish are African (14.7%, a difference of 0.33%), Ottawa (14.6%, a difference of 0.44%), French Canadian (14.6%, a difference of 0.63%), Immigrants from Dominican Republic (14.8%, a difference of 0.67%), and Nonimmigrants (14.6%, a difference of 0.74%).
| Demographics | Rating | Rank | Single Male Poverty |
| Whites/Caucasians | 0.0 /100 | #288 | Tragic 14.5% |
| Immigrants | Dominica | 0.0 /100 | #289 | Tragic 14.5% |
| U.S. Virgin Islanders | 0.0 /100 | #290 | Tragic 14.5% |
| Bahamians | 0.0 /100 | #291 | Tragic 14.6% |
| Immigrants | Nonimmigrants | 0.0 /100 | #292 | Tragic 14.6% |
| French Canadians | 0.0 /100 | #293 | Tragic 14.6% |
| Ottawa | 0.0 /100 | #294 | Tragic 14.6% |
| Scotch-Irish | 0.0 /100 | #295 | Tragic 14.7% |
| Africans | 0.0 /100 | #296 | Tragic 14.7% |
| Immigrants | Dominican Republic | 0.0 /100 | #297 | Tragic 14.8% |
| French American Indians | 0.0 /100 | #298 | Tragic 15.0% |
| Delaware | 0.0 /100 | #299 | Tragic 15.0% |
| Cree | 0.0 /100 | #300 | Tragic 15.1% |
| Dominicans | 0.0 /100 | #301 | Tragic 15.2% |
| Alsatians | 0.0 /100 | #302 | Tragic 15.2% |
Demographics Similar to Immigrants from China by Single Male Poverty
In terms of single male poverty, the demographic groups most similar to Immigrants from China are Immigrants from Asia (11.4%, a difference of 0.070%), Immigrants from Egypt (11.4%, a difference of 0.17%), Iranian (11.4%, a difference of 0.23%), Immigrants from Iran (11.4%, a difference of 0.32%), and Immigrants from Eastern Asia (11.4%, a difference of 0.40%).
| Demographics | Rating | Rank | Single Male Poverty |
| Ethiopians | 100.0 /100 | #20 | Exceptional 11.2% |
| Asians | 100.0 /100 | #21 | Exceptional 11.2% |
| Immigrants | Pakistan | 100.0 /100 | #22 | Exceptional 11.2% |
| Bolivians | 100.0 /100 | #23 | Exceptional 11.2% |
| Indians (Asian) | 100.0 /100 | #24 | Exceptional 11.3% |
| Maltese | 100.0 /100 | #25 | Exceptional 11.3% |
| Immigrants | Japan | 100.0 /100 | #26 | Exceptional 11.3% |
| Immigrants | China | 100.0 /100 | #27 | Exceptional 11.4% |
| Immigrants | Asia | 100.0 /100 | #28 | Exceptional 11.4% |
| Immigrants | Egypt | 100.0 /100 | #29 | Exceptional 11.4% |
| Iranians | 100.0 /100 | #30 | Exceptional 11.4% |
| Immigrants | Iran | 100.0 /100 | #31 | Exceptional 11.4% |
| Immigrants | Eastern Asia | 100.0 /100 | #32 | Exceptional 11.4% |
| Immigrants | Vietnam | 100.0 /100 | #33 | Exceptional 11.4% |
| Immigrants | Ethiopia | 100.0 /100 | #34 | Exceptional 11.4% |