Scandinavian vs Houma Single Female Poverty
COMPARE
Scandinavian
Houma
Single Female Poverty
Single Female Poverty Comparison
Scandinavians
Houma
21.1%
SINGLE FEMALE POVERTY
45.2/ 100
METRIC RATING
177th/ 347
METRIC RANK
33.8%
SINGLE FEMALE POVERTY
0.0/ 100
METRIC RATING
345th/ 347
METRIC RANK
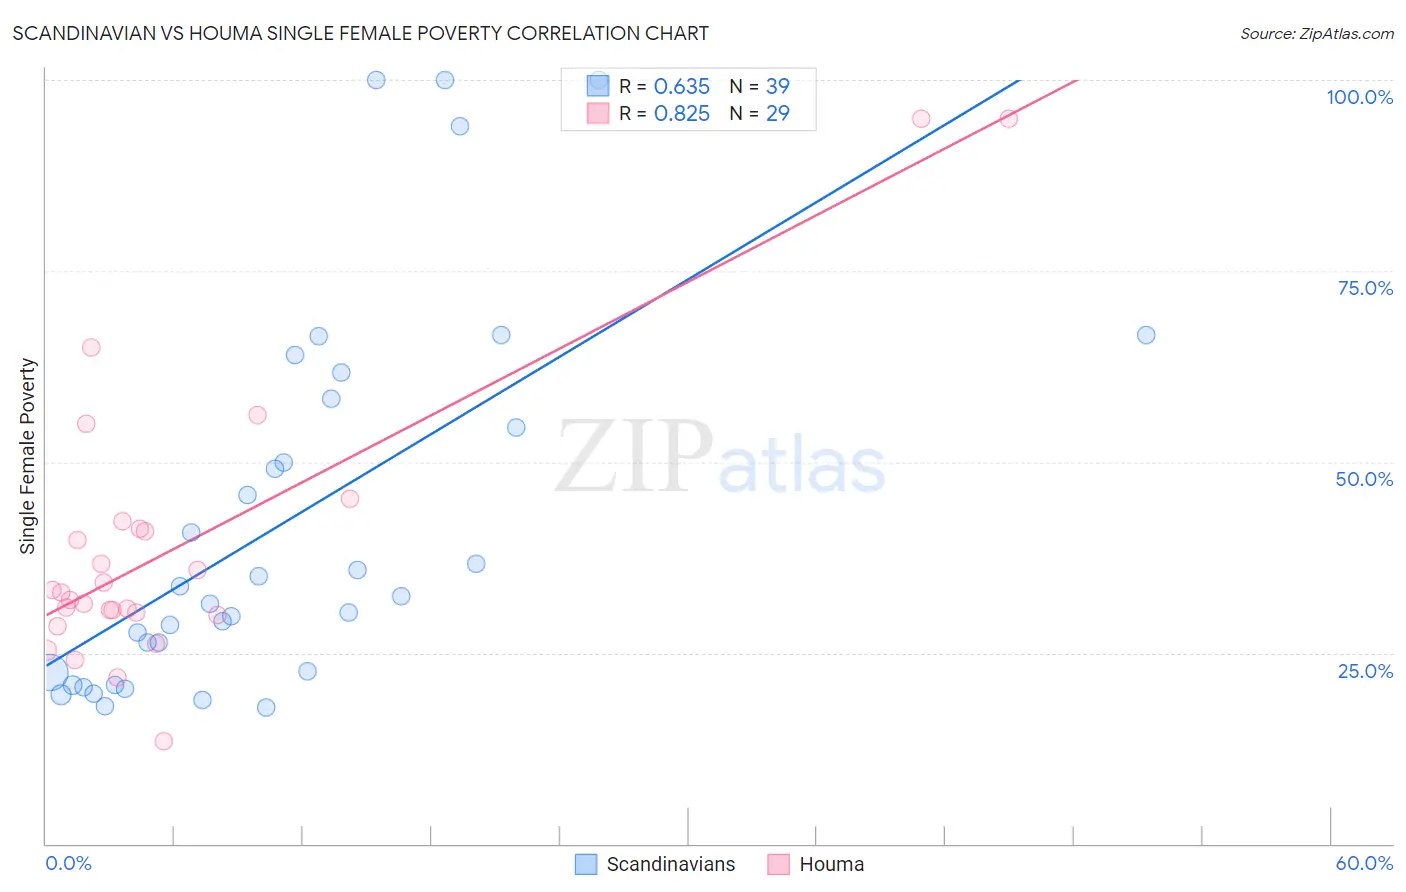
Scandinavian vs Houma Single Female Poverty Correlation Chart
The statistical analysis conducted on geographies consisting of 461,288,786 people shows a significant positive correlation between the proportion of Scandinavians and poverty level among single females in the United States with a correlation coefficient (R) of 0.635 and weighted average of 21.1%. Similarly, the statistical analysis conducted on geographies consisting of 36,729,698 people shows a very strong positive correlation between the proportion of Houma and poverty level among single females in the United States with a correlation coefficient (R) of 0.825 and weighted average of 33.8%, a difference of 60.4%.
Single Female Poverty Correlation Summary
| Measurement | Scandinavian | Houma |
| Minimum | 17.8% | 13.4% |
| Maximum | 100.0% | 94.8% |
| Range | 82.2% | 81.5% |
| Mean | 42.1% | 39.1% |
| Median | 32.4% | 33.0% |
| Interquartile 25% (IQ1) | 22.3% | 30.1% |
| Interquartile 75% (IQ3) | 58.3% | 41.8% |
| Interquartile Range (IQR) | 36.0% | 11.6% |
| Standard Deviation (Sample) | 24.6% | 18.7% |
| Standard Deviation (Population) | 24.3% | 18.4% |
Similar Demographics by Single Female Poverty
Demographics Similar to Scandinavians by Single Female Poverty
In terms of single female poverty, the demographic groups most similar to Scandinavians are Canadian (21.1%, a difference of 0.010%), Immigrants from Bosnia and Herzegovina (21.1%, a difference of 0.020%), Czech (21.0%, a difference of 0.10%), British (21.1%, a difference of 0.14%), and Spanish American Indian (21.1%, a difference of 0.17%).
| Demographics | Rating | Rank | Single Female Poverty |
| New Zealanders | 53.2 /100 | #170 | Average 21.0% |
| Moroccans | 52.8 /100 | #171 | Average 21.0% |
| Guyanese | 52.0 /100 | #172 | Average 21.0% |
| Immigrants | Guyana | 50.6 /100 | #173 | Average 21.0% |
| Cubans | 50.0 /100 | #174 | Average 21.0% |
| Czechs | 46.8 /100 | #175 | Average 21.0% |
| Canadians | 45.4 /100 | #176 | Average 21.1% |
| Scandinavians | 45.2 /100 | #177 | Average 21.1% |
| Immigrants | Bosnia and Herzegovina | 44.9 /100 | #178 | Average 21.1% |
| British | 42.9 /100 | #179 | Average 21.1% |
| Spanish American Indians | 42.5 /100 | #180 | Average 21.1% |
| Europeans | 42.3 /100 | #181 | Average 21.1% |
| Slavs | 40.5 /100 | #182 | Average 21.1% |
| Slovaks | 39.7 /100 | #183 | Fair 21.1% |
| Hungarians | 39.6 /100 | #184 | Fair 21.1% |
Demographics Similar to Houma by Single Female Poverty
In terms of single female poverty, the demographic groups most similar to Houma are Puerto Rican (34.1%, a difference of 0.92%), Tohono O'odham (34.2%, a difference of 1.2%), Lumbee (33.0%, a difference of 2.4%), Crow (32.4%, a difference of 4.3%), and Navajo (31.7%, a difference of 6.8%).
| Demographics | Rating | Rank | Single Female Poverty |
| Ute | 0.0 /100 | #333 | Tragic 28.4% |
| Pueblo | 0.0 /100 | #334 | Tragic 28.6% |
| Immigrants | Yemen | 0.0 /100 | #335 | Tragic 28.9% |
| Colville | 0.0 /100 | #336 | Tragic 29.1% |
| Yuman | 0.0 /100 | #337 | Tragic 29.4% |
| Pima | 0.0 /100 | #338 | Tragic 30.3% |
| Cheyenne | 0.0 /100 | #339 | Tragic 30.4% |
| Cajuns | 0.0 /100 | #340 | Tragic 30.6% |
| Sioux | 0.0 /100 | #341 | Tragic 31.3% |
| Navajo | 0.0 /100 | #342 | Tragic 31.7% |
| Crow | 0.0 /100 | #343 | Tragic 32.4% |
| Lumbee | 0.0 /100 | #344 | Tragic 33.0% |
| Houma | 0.0 /100 | #345 | Tragic 33.8% |
| Puerto Ricans | 0.0 /100 | #346 | Tragic 34.1% |
| Tohono O'odham | 0.0 /100 | #347 | Tragic 34.2% |