French vs Immigrants from Nepal Family Poverty
COMPARE
French
Immigrants from Nepal
Family Poverty
Family Poverty Comparison
French
Immigrants from Nepal
8.3%
FAMILY POVERTY
92.8/ 100
METRIC RATING
119th/ 347
METRIC RANK
8.5%
FAMILY POVERTY
84.2/ 100
METRIC RATING
139th/ 347
METRIC RANK
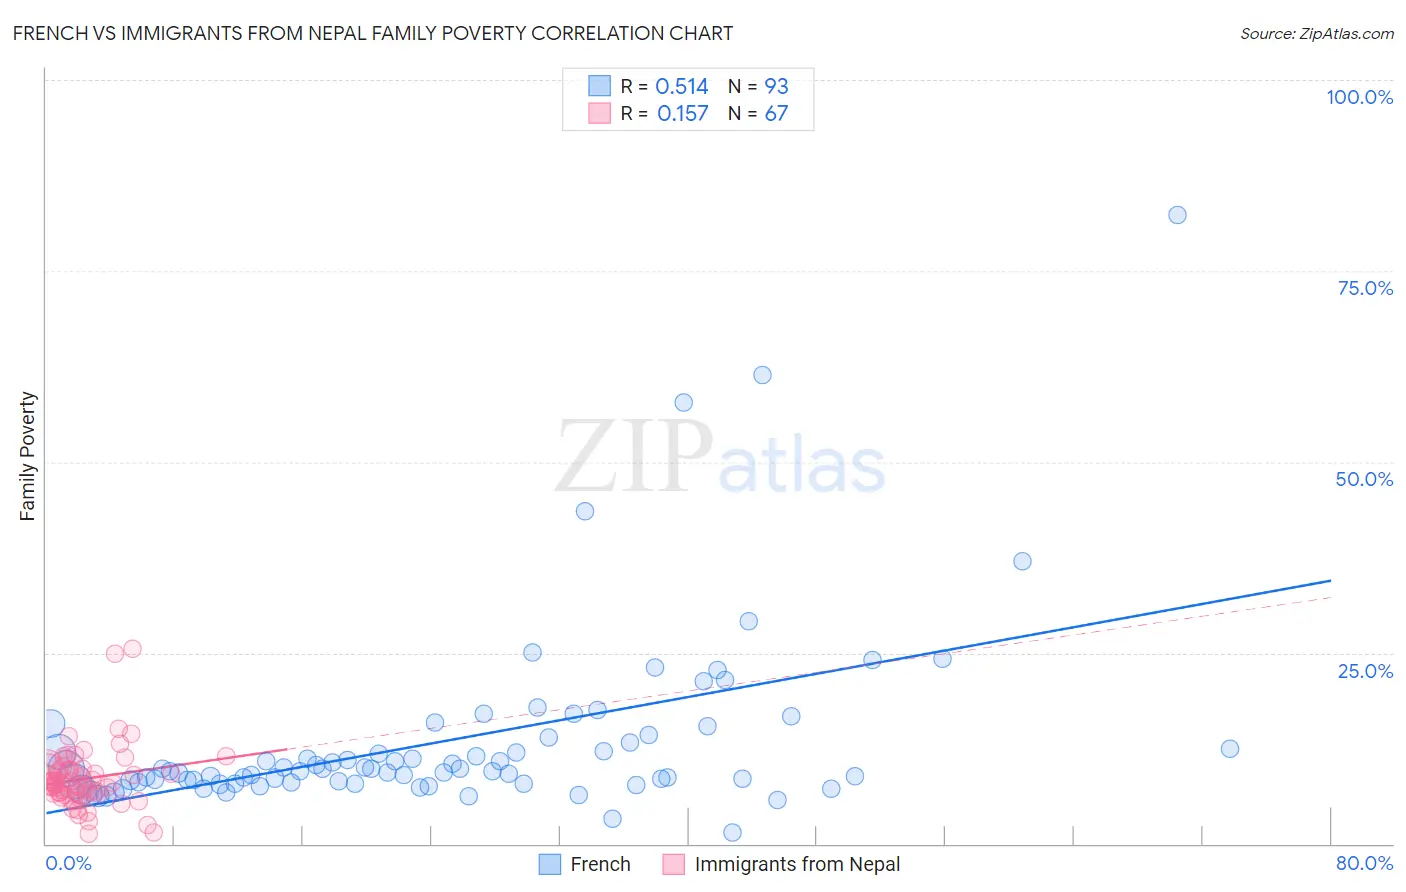
French vs Immigrants from Nepal Family Poverty Correlation Chart
The statistical analysis conducted on geographies consisting of 567,554,801 people shows a substantial positive correlation between the proportion of French and poverty level among families in the United States with a correlation coefficient (R) of 0.514 and weighted average of 8.3%. Similarly, the statistical analysis conducted on geographies consisting of 186,522,018 people shows a poor positive correlation between the proportion of Immigrants from Nepal and poverty level among families in the United States with a correlation coefficient (R) of 0.157 and weighted average of 8.5%, a difference of 3.2%.
Family Poverty Correlation Summary
| Measurement | French | Immigrants from Nepal |
| Minimum | 1.5% | 1.3% |
| Maximum | 82.4% | 25.5% |
| Range | 80.9% | 24.2% |
| Mean | 13.4% | 8.5% |
| Median | 9.6% | 8.0% |
| Interquartile 25% (IQ1) | 8.0% | 6.6% |
| Interquartile 75% (IQ3) | 13.6% | 9.8% |
| Interquartile Range (IQR) | 5.6% | 3.2% |
| Standard Deviation (Sample) | 12.0% | 4.1% |
| Standard Deviation (Population) | 11.9% | 4.1% |
Demographics Similar to French and Immigrants from Nepal by Family Poverty
In terms of family poverty, the demographic groups most similar to French are Immigrants from Egypt (8.3%, a difference of 0.56%), Native Hawaiian (8.3%, a difference of 0.73%), Paraguayan (8.3%, a difference of 0.74%), Palestinian (8.3%, a difference of 0.81%), and Soviet Union (8.3%, a difference of 0.92%). Similarly, the demographic groups most similar to Immigrants from Nepal are Armenian (8.5%, a difference of 0.12%), Immigrants from Southern Europe (8.5%, a difference of 0.52%), Immigrants from Brazil (8.5%, a difference of 0.60%), Immigrants from Malaysia (8.5%, a difference of 0.64%), and Sri Lankan (8.5%, a difference of 0.68%).
| Demographics | Rating | Rank | Family Poverty |
| French | 92.8 /100 | #119 | Exceptional 8.3% |
| Immigrants | Egypt | 91.6 /100 | #120 | Exceptional 8.3% |
| Native Hawaiians | 91.3 /100 | #121 | Exceptional 8.3% |
| Paraguayans | 91.2 /100 | #122 | Exceptional 8.3% |
| Palestinians | 91.1 /100 | #123 | Exceptional 8.3% |
| Soviet Union | 90.8 /100 | #124 | Exceptional 8.3% |
| Pakistanis | 90.8 /100 | #125 | Exceptional 8.3% |
| Icelanders | 90.3 /100 | #126 | Exceptional 8.3% |
| Immigrants | Hungary | 89.9 /100 | #127 | Excellent 8.4% |
| Argentineans | 89.6 /100 | #128 | Excellent 8.4% |
| Portuguese | 89.2 /100 | #129 | Excellent 8.4% |
| Immigrants | Bosnia and Herzegovina | 88.6 /100 | #130 | Excellent 8.4% |
| Puget Sound Salish | 88.6 /100 | #131 | Excellent 8.4% |
| Immigrants | Argentina | 88.2 /100 | #132 | Excellent 8.4% |
| Sri Lankans | 86.6 /100 | #133 | Excellent 8.5% |
| Chileans | 86.6 /100 | #134 | Excellent 8.5% |
| Immigrants | Malaysia | 86.5 /100 | #135 | Excellent 8.5% |
| Immigrants | Brazil | 86.3 /100 | #136 | Excellent 8.5% |
| Immigrants | Southern Europe | 86.0 /100 | #137 | Excellent 8.5% |
| Armenians | 84.6 /100 | #138 | Excellent 8.5% |
| Immigrants | Nepal | 84.2 /100 | #139 | Excellent 8.5% |