Immigrants from Southern Europe vs Immigrants from Nepal Family Poverty

COMPARE

Immigrants from Southern Europe
Race
Ancestry
AfghanAfricanAlaska NativeAlaskan AthabascanAlbanianAleutAlsatianAmericanApacheArabArapahoArgentineanArmenianAssyrian/Chaldean/SyriacAustralianAustrianBahamianBangladeshiBarbadianBasqueBelgianBelizeanBermudanBhutaneseBlackfeetBolivianBrazilianBritishBritish West IndianBulgarianBurmeseCajunCambodianCanadianCape VerdeanCarpatho RusynCelticCentral AmericanCentral American IndianCherokeeCheyenneChickasawChileanChineseChippewaChoctawColombianColvilleComancheCosta RicanCreeCreekCroatianCrowCubanCypriotCzechCzechoslovakianDanishDelawareDominicanDutchDutch West IndianEastern EuropeanEcuadorianEgyptianEnglishEstonianEthiopianEuropeanFijianFilipinoFinnishFrenchFrench American IndianFrench CanadianGermanGerman RussianGhanaianGreekGuamanian/ChamorroGuatemalanGuyaneseHaitianHmongHonduranHopiHoumaHungarianIcelanderIndian (Asian)IndonesianInupiatIranianIraqiIrishIroquoisIsraeliItalianJamaicanJapaneseJordanianKenyanKiowaKoreanLaotianLatvianLebaneseLiberianLithuanianLumbeeLuxembourgerMacedonianMalaysianMalteseMarshalleseMenomineeMexicanMexican American IndianMongolianMoroccanNative HawaiianNavajoNepaleseNew ZealanderNicaraguanNigerianNorthern EuropeanNorwegianOkinawanOsageOttawaPaiutePakistaniPalestinianPanamanianParaguayanPennsylvania GermanPeruvianPimaPolishPortuguesePotawatomiPuebloPuerto RicanPuget Sound SalishRomanianRussianSalvadoranSamoanScandinavianScotch-IrishScottishSeminoleSenegaleseSerbianShoshoneSierra LeoneanSiouxSlavicSlovakSloveneSomaliSouth AfricanSouth AmericanSouth American IndianSoviet UnionSpaniardSpanishSpanish AmericanSpanish American IndianSri LankanSubsaharan AfricanSudaneseSwedishSwissSyrianTaiwaneseThaiTlingit-HaidaTohono O'OdhamTonganTrinidadian and TobagonianTsimshianTurkishU.S. Virgin IslanderUgandanUkrainianUruguayanUteVenezuelanVietnameseWelshWest IndianYakamaYaquiYugoslavianYumanYup'ikZimbabwean
Immigration
NonimmigrantsImmigrantsAfghanistanAfricaAlbaniaArgentinaArmeniaAsiaAustraliaAustriaBahamasBangladeshBarbadosBelarusBelgiumBelizeBoliviaBosnia and HerzegovinaBrazilBulgariaBurma/MyanmarCabo VerdeCambodiaCameroonCanadaCaribbeanCentral AmericaChileChinaColombiaCongoCosta RicaCroatiaCubaCzechoslovakiaDenmarkDominicaDominican RepublicEastern AfricaEastern AsiaEastern EuropeEcuadorEgyptEl SalvadorEnglandEritreaEthiopiaEuropeFijiFranceGermanyGhanaGreeceGrenadaGuatemalaGuyanaHaitiHondurasHong KongHungaryIndiaIndonesiaIranIraqIrelandIsraelItalyJamaicaJapanJordanKazakhstanKenyaKoreaKuwaitLaosLatin AmericaLatviaLebanonLiberiaLithuaniaMalaysiaMexicoMicronesiaMiddle AfricaMoldovaMoroccoNetherlandsNicaraguaNigeriaNorth AmericaNorth MacedoniaNorthern AfricaNorthern EuropeNorwayOceaniaPakistanPanamaPeruPhilippinesPolandPortugalRomaniaRussiaSaudi ArabiaScotlandSenegalSerbiaSierra LeoneSingaporeSomaliaSouth AfricaSouth AmericaSouth Central AsiaSouth Eastern AsiaSouthern EuropeSpainSri LankaSt. Vincent and the GrenadinesSudanSwedenSwitzerlandSyriaTaiwanThailandTrinidad and TobagoTurkeyUgandaUkraineUruguayUzbekistanVenezuelaVietnamWest IndiesWestern AfricaWestern AsiaWestern EuropeYemenZaireZimbabweAzores
Immigrants from Nepal
Race
Ancestry
AfghanAfricanAlaska NativeAlaskan AthabascanAlbanianAleutAlsatianAmericanApacheArabArapahoArgentineanArmenianAssyrian/Chaldean/SyriacAustralianAustrianBahamianBangladeshiBarbadianBasqueBelgianBelizeanBermudanBhutaneseBlackfeetBolivianBrazilianBritishBritish West IndianBulgarianBurmeseCajunCambodianCanadianCape VerdeanCarpatho RusynCelticCentral AmericanCentral American IndianCherokeeCheyenneChickasawChileanChineseChippewaChoctawColombianColvilleComancheCosta RicanCreeCreekCroatianCrowCubanCypriotCzechCzechoslovakianDanishDelawareDominicanDutchDutch West IndianEastern EuropeanEcuadorianEgyptianEnglishEstonianEthiopianEuropeanFijianFilipinoFinnishFrenchFrench American IndianFrench CanadianGermanGerman RussianGhanaianGreekGuamanian/ChamorroGuatemalanGuyaneseHaitianHmongHonduranHopiHoumaHungarianIcelanderIndian (Asian)IndonesianInupiatIranianIraqiIrishIroquoisIsraeliItalianJamaicanJapaneseJordanianKenyanKiowaKoreanLaotianLatvianLebaneseLiberianLithuanianLumbeeLuxembourgerMacedonianMalaysianMalteseMarshalleseMenomineeMexicanMexican American IndianMongolianMoroccanNative HawaiianNavajoNepaleseNew ZealanderNicaraguanNigerianNorthern EuropeanNorwegianOkinawanOsageOttawaPaiutePakistaniPalestinianPanamanianParaguayanPennsylvania GermanPeruvianPimaPolishPortuguesePotawatomiPuebloPuerto RicanPuget Sound SalishRomanianRussianSalvadoranSamoanScandinavianScotch-IrishScottishSeminoleSenegaleseSerbianShoshoneSierra LeoneanSiouxSlavicSlovakSloveneSomaliSouth AfricanSouth AmericanSouth American IndianSoviet UnionSpaniardSpanishSpanish AmericanSpanish American IndianSri LankanSubsaharan AfricanSudaneseSwedishSwissSyrianTaiwaneseThaiTlingit-HaidaTohono O'OdhamTonganTrinidadian and TobagonianTsimshianTurkishU.S. Virgin IslanderUgandanUkrainianUruguayanUteVenezuelanVietnameseWelshWest IndianYakamaYaquiYugoslavianYumanYup'ikZimbabwean
Immigration
NonimmigrantsImmigrantsAfghanistanAfricaAlbaniaArgentinaArmeniaAsiaAustraliaAustriaBahamasBangladeshBarbadosBelarusBelgiumBelizeBoliviaBosnia and HerzegovinaBrazilBulgariaBurma/MyanmarCabo VerdeCambodiaCameroonCanadaCaribbeanCentral AmericaChileChinaColombiaCongoCosta RicaCroatiaCubaCzechoslovakiaDenmarkDominicaDominican RepublicEastern AfricaEastern AsiaEastern EuropeEcuadorEgyptEl SalvadorEnglandEritreaEthiopiaEuropeFijiFranceGermanyGhanaGreeceGrenadaGuatemalaGuyanaHaitiHondurasHong KongHungaryIndiaIndonesiaIranIraqIrelandIsraelItalyJamaicaJapanJordanKazakhstanKenyaKoreaKuwaitLaosLatin AmericaLatviaLebanonLiberiaLithuaniaMalaysiaMexicoMicronesiaMiddle AfricaMoldovaMoroccoNepalNetherlandsNicaraguaNigeriaNorth AmericaNorth MacedoniaNorthern AfricaNorthern EuropeNorwayOceaniaPakistanPanamaPeruPhilippinesPolandPortugalRomaniaRussiaSaudi ArabiaScotlandSenegalSerbiaSierra LeoneSingaporeSomaliaSouth AfricaSouth AmericaSouth Central AsiaSouth Eastern AsiaSpainSri LankaSt. Vincent and the GrenadinesSudanSwedenSwitzerlandSyriaTaiwanThailandTrinidad and TobagoTurkeyUgandaUkraineUruguayUzbekistanVenezuelaVietnamWest IndiesWestern AfricaWestern AsiaWestern EuropeYemenZaireZimbabweAzores
Family Poverty
Income
Poverty
Unemployment
Labor Participation
Family Structure
Vehicle Availability
Education Level
Disability

Family Poverty Comparison

Immigrants from Southern Europe

Immigrants from Nepal

Excellent
Excellent
8.5%
FAMILY POVERTY
86.0/ 100
METRIC RATING
137th/ 347
METRIC RANK
8.5%
FAMILY POVERTY
84.2/ 100
METRIC RATING
139th/ 347
METRIC RANK

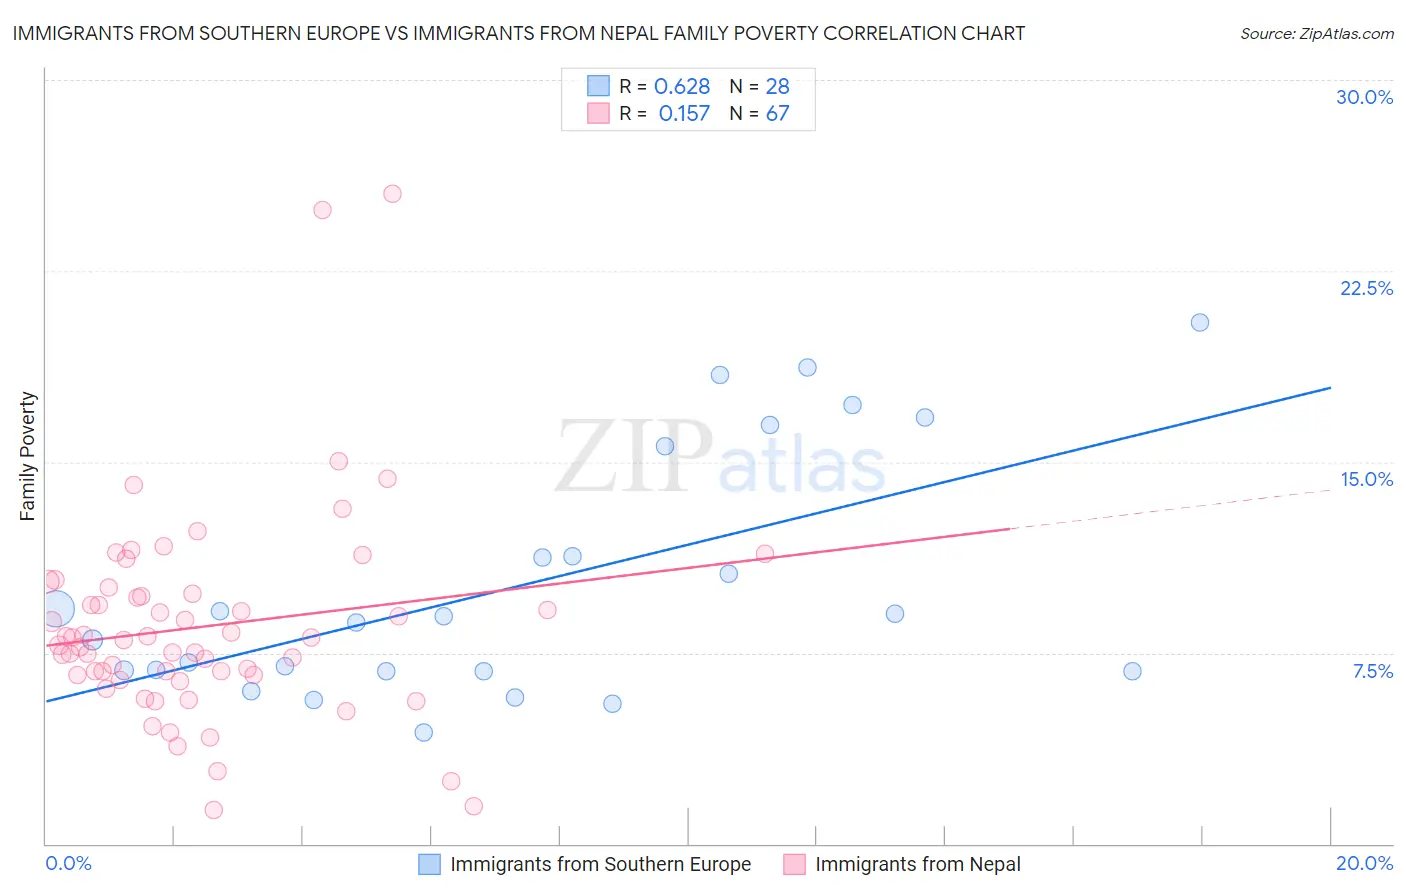
Immigrants from Southern Europe vs Immigrants from Nepal Family Poverty Correlation Chart

The statistical analysis conducted on geographies consisting of 401,468,990 people shows a significant positive correlation between the proportion of Immigrants from Southern Europe and poverty level among families in the United States with a correlation coefficient (R) of 0.628 and weighted average of 8.5%. Similarly, the statistical analysis conducted on geographies consisting of 186,522,018 people shows a poor positive correlation between the proportion of Immigrants from Nepal and poverty level among families in the United States with a correlation coefficient (R) of 0.157 and weighted average of 8.5%, a difference of 0.52%.
Immigrants from Southern Europe vs Immigrants from Nepal Family Poverty

Family Poverty Correlation Summary

MeasurementImmigrants from Southern EuropeImmigrants from Nepal
Minimum4.4%1.3%
Maximum20.5%25.5%
Range16.1%24.2%
Mean10.2%8.5%
Median8.8%8.0%
Interquartile 25% (IQ1)6.8%6.6%
Interquartile 75% (IQ3)13.5%9.8%
Interquartile Range (IQR)6.7%3.2%
Standard Deviation (Sample)4.8%4.1%
Standard Deviation (Population)4.7%4.1%

Demographics Similar to Immigrants from Southern Europe and Immigrants from Nepal by Family Poverty

In terms of family poverty, the demographic groups most similar to Immigrants from Southern Europe are Immigrants from Brazil (8.5%, a difference of 0.080%), Immigrants from Malaysia (8.5%, a difference of 0.12%), Chilean (8.5%, a difference of 0.16%), Sri Lankan (8.5%, a difference of 0.17%), and Armenian (8.5%, a difference of 0.40%). Similarly, the demographic groups most similar to Immigrants from Nepal are Immigrants from Kazakhstan (8.5%, a difference of 0.030%), Immigrants from Ukraine (8.5%, a difference of 0.060%), Armenian (8.5%, a difference of 0.12%), Yugoslavian (8.5%, a difference of 0.17%), and Immigrants from Germany (8.5%, a difference of 0.21%).
DemographicsRating | RankFamily Poverty
Argentineans
89.6
/100
|
#128
Excellent
8.4%
Portuguese
89.2
/100
|
#129
Excellent
8.4%
Immigrants | Bosnia and Herzegovina
88.6
/100
|
#130
Excellent
8.4%
Puget Sound Salish
88.6
/100
|
#131
Excellent
8.4%
Immigrants | Argentina
88.2
/100
|
#132
Excellent
8.4%
Sri Lankans
86.6
/100
|
#133
Excellent
8.5%
Chileans
86.6
/100
|
#134
Excellent
8.5%
Immigrants | Malaysia
86.5
/100
|
#135
Excellent
8.5%
Immigrants | Brazil
86.3
/100
|
#136
Excellent
8.5%
Immigrants | Southern Europe
86.0
/100
|
#137
Excellent
8.5%
Armenians
84.6
/100
|
#138
Excellent
8.5%
Immigrants | Nepal
84.2
/100
|
#139
Excellent
8.5%
Immigrants | Kazakhstan
84.1
/100
|
#140
Excellent
8.5%
Immigrants | Ukraine
83.9
/100
|
#141
Excellent
8.5%
Yugoslavians
83.5
/100
|
#142
Excellent
8.5%
Immigrants | Germany
83.3
/100
|
#143
Excellent
8.5%
Albanians
83.3
/100
|
#144
Excellent
8.5%
Immigrants | South Eastern Asia
83.2
/100
|
#145
Excellent
8.5%
Immigrants | Belarus
83.2
/100
|
#146
Excellent
8.5%
Immigrants | Jordan
83.0
/100
|
#147
Excellent
8.5%
Scotch-Irish
82.2
/100
|
#148
Excellent
8.6%