Scandinavian vs Immigrants from Nepal Per Capita Income
COMPARE
Scandinavian
Immigrants from Nepal
Per Capita Income
Per Capita Income Comparison
Scandinavians
Immigrants from Nepal
$43,848
PER CAPITA INCOME
55.2/ 100
METRIC RATING
170th/ 347
METRIC RANK
$44,187
PER CAPITA INCOME
64.3/ 100
METRIC RATING
158th/ 347
METRIC RANK
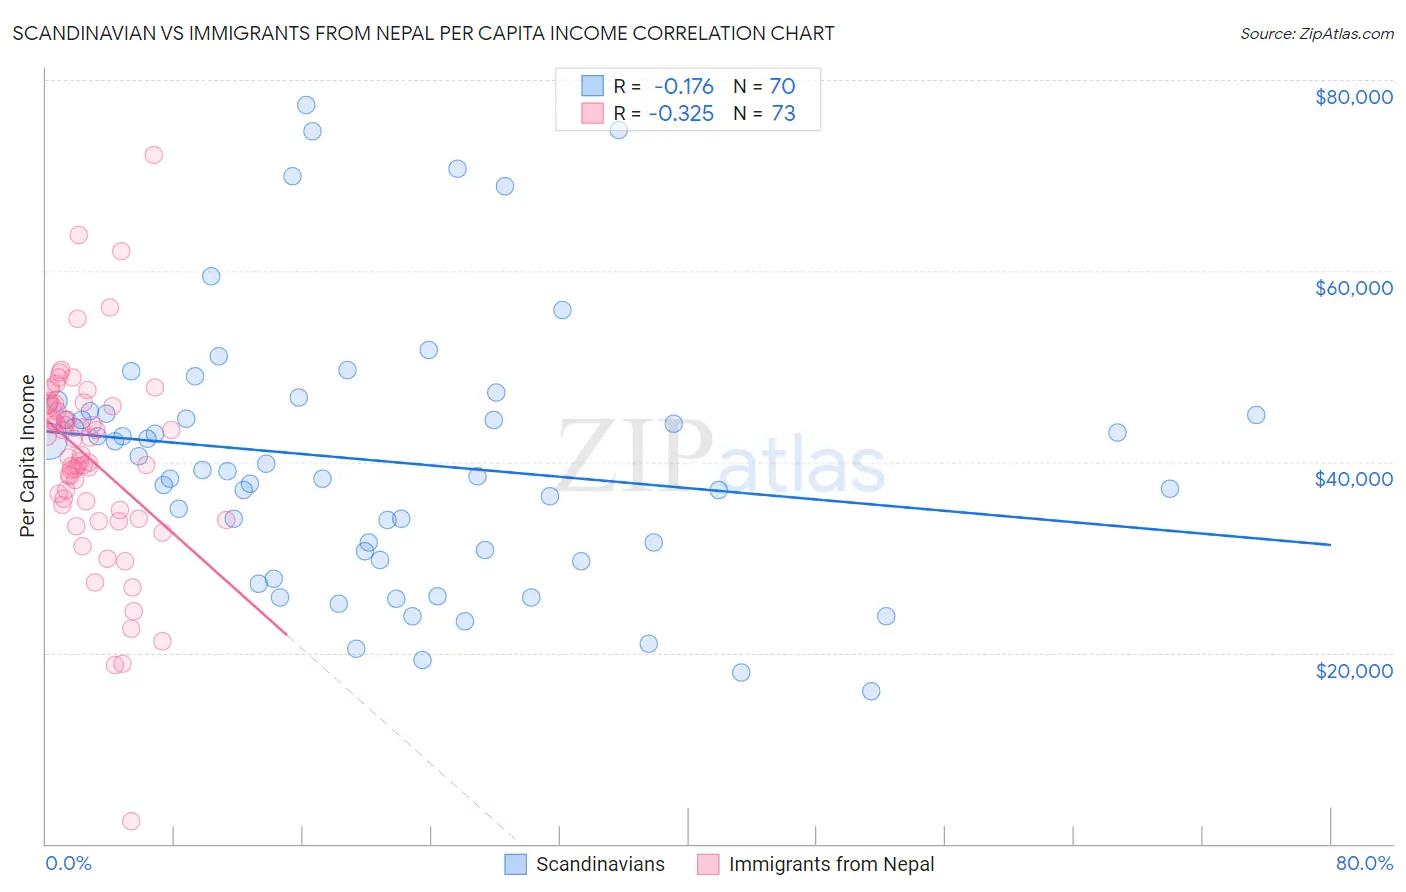
Scandinavian vs Immigrants from Nepal Per Capita Income Correlation Chart
The statistical analysis conducted on geographies consisting of 472,676,138 people shows a poor negative correlation between the proportion of Scandinavians and per capita income in the United States with a correlation coefficient (R) of -0.176 and weighted average of $43,848. Similarly, the statistical analysis conducted on geographies consisting of 186,792,214 people shows a mild negative correlation between the proportion of Immigrants from Nepal and per capita income in the United States with a correlation coefficient (R) of -0.325 and weighted average of $44,187, a difference of 0.77%.
Per Capita Income Correlation Summary
| Measurement | Scandinavian | Immigrants from Nepal |
| Minimum | $15,911 | $2,302 |
| Maximum | $77,383 | $72,138 |
| Range | $61,472 | $69,836 |
| Mean | $40,106 | $40,351 |
| Median | $39,048 | $40,773 |
| Interquartile 25% (IQ1) | $30,666 | $35,186 |
| Interquartile 75% (IQ3) | $45,055 | $46,005 |
| Interquartile Range (IQR) | $14,389 | $10,819 |
| Standard Deviation (Sample) | $13,782 | $10,460 |
| Standard Deviation (Population) | $13,683 | $10,388 |
Demographics Similar to Scandinavians and Immigrants from Nepal by Per Capita Income
In terms of per capita income, the demographic groups most similar to Scandinavians are Immigrants from Peru ($43,852, a difference of 0.010%), Immigrants from Eastern Africa ($43,838, a difference of 0.020%), Czechoslovakian ($43,806, a difference of 0.090%), Belgian ($43,951, a difference of 0.24%), and English ($43,982, a difference of 0.31%). Similarly, the demographic groups most similar to Immigrants from Nepal are South American Indian ($44,206, a difference of 0.040%), Slovak ($44,229, a difference of 0.090%), South American ($44,114, a difference of 0.17%), Danish ($44,095, a difference of 0.21%), and Costa Rican ($44,090, a difference of 0.22%).
| Demographics | Rating | Rank | Per Capita Income |
| Portuguese | 68.7 /100 | #154 | Good $44,362 |
| Uruguayans | 67.6 /100 | #155 | Good $44,318 |
| Slovaks | 65.4 /100 | #156 | Good $44,229 |
| South American Indians | 64.8 /100 | #157 | Good $44,206 |
| Immigrants | Nepal | 64.3 /100 | #158 | Good $44,187 |
| South Americans | 62.4 /100 | #159 | Good $44,114 |
| Danes | 61.9 /100 | #160 | Good $44,095 |
| Costa Ricans | 61.8 /100 | #161 | Good $44,090 |
| Swiss | 61.4 /100 | #162 | Good $44,076 |
| Immigrants | South America | 61.2 /100 | #163 | Good $44,068 |
| Sri Lankans | 59.8 /100 | #164 | Average $44,014 |
| Immigrants | Philippines | 59.4 /100 | #165 | Average $44,000 |
| Immigrants | Uruguay | 59.3 /100 | #166 | Average $43,997 |
| English | 58.9 /100 | #167 | Average $43,982 |
| Belgians | 58.1 /100 | #168 | Average $43,951 |
| Immigrants | Peru | 55.3 /100 | #169 | Average $43,852 |
| Scandinavians | 55.2 /100 | #170 | Average $43,848 |
| Immigrants | Eastern Africa | 54.9 /100 | #171 | Average $43,838 |
| Czechoslovakians | 54.1 /100 | #172 | Average $43,806 |
| French | 50.7 /100 | #173 | Average $43,685 |
| Colombians | 50.0 /100 | #174 | Average $43,661 |