Scandinavian vs Immigrants from Kuwait Cognitive Disability
COMPARE
Scandinavian
Immigrants from Kuwait
Cognitive Disability
Cognitive Disability Comparison
Scandinavians
Immigrants from Kuwait
16.9%
COGNITIVE DISABILITY
94.1/ 100
METRIC RATING
125th/ 347
METRIC RANK
18.1%
COGNITIVE DISABILITY
0.2/ 100
METRIC RATING
277th/ 347
METRIC RANK
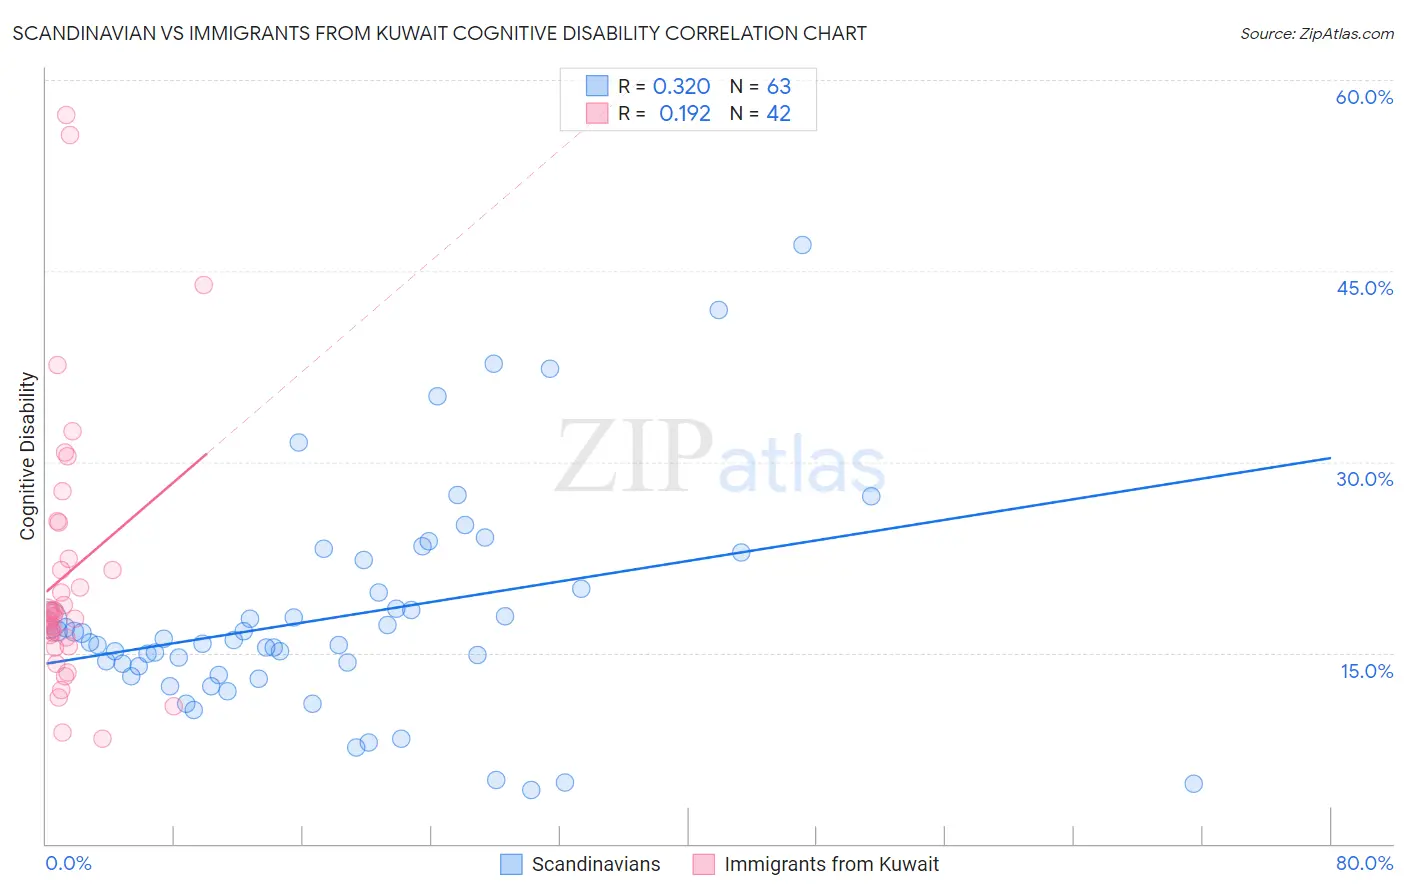
Scandinavian vs Immigrants from Kuwait Cognitive Disability Correlation Chart
The statistical analysis conducted on geographies consisting of 472,549,780 people shows a mild positive correlation between the proportion of Scandinavians and percentage of population with cognitive disability in the United States with a correlation coefficient (R) of 0.320 and weighted average of 16.9%. Similarly, the statistical analysis conducted on geographies consisting of 136,916,630 people shows a poor positive correlation between the proportion of Immigrants from Kuwait and percentage of population with cognitive disability in the United States with a correlation coefficient (R) of 0.192 and weighted average of 18.1%, a difference of 6.7%.
Cognitive Disability Correlation Summary
| Measurement | Scandinavian | Immigrants from Kuwait |
| Minimum | 4.2% | 8.3% |
| Maximum | 47.1% | 57.2% |
| Range | 42.9% | 49.0% |
| Mean | 17.8% | 21.2% |
| Median | 15.8% | 18.0% |
| Interquartile 25% (IQ1) | 13.3% | 16.2% |
| Interquartile 75% (IQ3) | 20.0% | 22.4% |
| Interquartile Range (IQR) | 6.7% | 6.3% |
| Standard Deviation (Sample) | 8.6% | 10.8% |
| Standard Deviation (Population) | 8.5% | 10.6% |
Similar Demographics by Cognitive Disability
Demographics Similar to Scandinavians by Cognitive Disability
In terms of cognitive disability, the demographic groups most similar to Scandinavians are Turkish (16.9%, a difference of 0.050%), Portuguese (16.9%, a difference of 0.080%), Immigrants from Western Europe (16.9%, a difference of 0.090%), European (17.0%, a difference of 0.090%), and Immigrants from China (16.9%, a difference of 0.10%).
| Demographics | Rating | Rank | Cognitive Disability |
| Immigrants | Denmark | 96.2 /100 | #118 | Exceptional 16.9% |
| South Africans | 95.5 /100 | #119 | Exceptional 16.9% |
| Scottish | 95.0 /100 | #120 | Exceptional 16.9% |
| Immigrants | China | 94.9 /100 | #121 | Exceptional 16.9% |
| Immigrants | Western Europe | 94.8 /100 | #122 | Exceptional 16.9% |
| Portuguese | 94.7 /100 | #123 | Exceptional 16.9% |
| Turks | 94.5 /100 | #124 | Exceptional 16.9% |
| Scandinavians | 94.1 /100 | #125 | Exceptional 16.9% |
| Europeans | 93.4 /100 | #126 | Exceptional 17.0% |
| Immigrants | Costa Rica | 93.1 /100 | #127 | Exceptional 17.0% |
| Nicaraguans | 93.0 /100 | #128 | Exceptional 17.0% |
| Immigrants | Uruguay | 92.9 /100 | #129 | Exceptional 17.0% |
| Immigrants | Vietnam | 92.4 /100 | #130 | Exceptional 17.0% |
| Immigrants | Germany | 92.1 /100 | #131 | Exceptional 17.0% |
| Whites/Caucasians | 92.1 /100 | #132 | Exceptional 17.0% |
Demographics Similar to Immigrants from Kuwait by Cognitive Disability
In terms of cognitive disability, the demographic groups most similar to Immigrants from Kuwait are Yuman (18.1%, a difference of 0.0%), Immigrants from Micronesia (18.1%, a difference of 0.010%), Immigrants from Laos (18.1%, a difference of 0.050%), Chippewa (18.1%, a difference of 0.060%), and West Indian (18.1%, a difference of 0.070%).
| Demographics | Rating | Rank | Cognitive Disability |
| Immigrants | Bahamas | 0.3 /100 | #270 | Tragic 18.0% |
| Potawatomi | 0.2 /100 | #271 | Tragic 18.0% |
| Immigrants | Honduras | 0.2 /100 | #272 | Tragic 18.0% |
| Immigrants | Nepal | 0.2 /100 | #273 | Tragic 18.0% |
| Immigrants | Nigeria | 0.2 /100 | #274 | Tragic 18.0% |
| Immigrants | Laos | 0.2 /100 | #275 | Tragic 18.1% |
| Yuman | 0.2 /100 | #276 | Tragic 18.1% |
| Immigrants | Kuwait | 0.2 /100 | #277 | Tragic 18.1% |
| Immigrants | Micronesia | 0.2 /100 | #278 | Tragic 18.1% |
| Chippewa | 0.1 /100 | #279 | Tragic 18.1% |
| West Indians | 0.1 /100 | #280 | Tragic 18.1% |
| Yakama | 0.1 /100 | #281 | Tragic 18.1% |
| Immigrants | Cambodia | 0.1 /100 | #282 | Tragic 18.1% |
| Nigerians | 0.1 /100 | #283 | Tragic 18.1% |
| Immigrants | Uganda | 0.1 /100 | #284 | Tragic 18.1% |