Scandinavian vs Immigrants from Kuwait 10th Grade
COMPARE
Scandinavian
Immigrants from Kuwait
10th Grade
10th Grade Comparison
Scandinavians
Immigrants from Kuwait
95.6%
10TH GRADE
100.0/ 100
METRIC RATING
19th/ 347
METRIC RANK
94.4%
10TH GRADE
96.8/ 100
METRIC RATING
112th/ 347
METRIC RANK
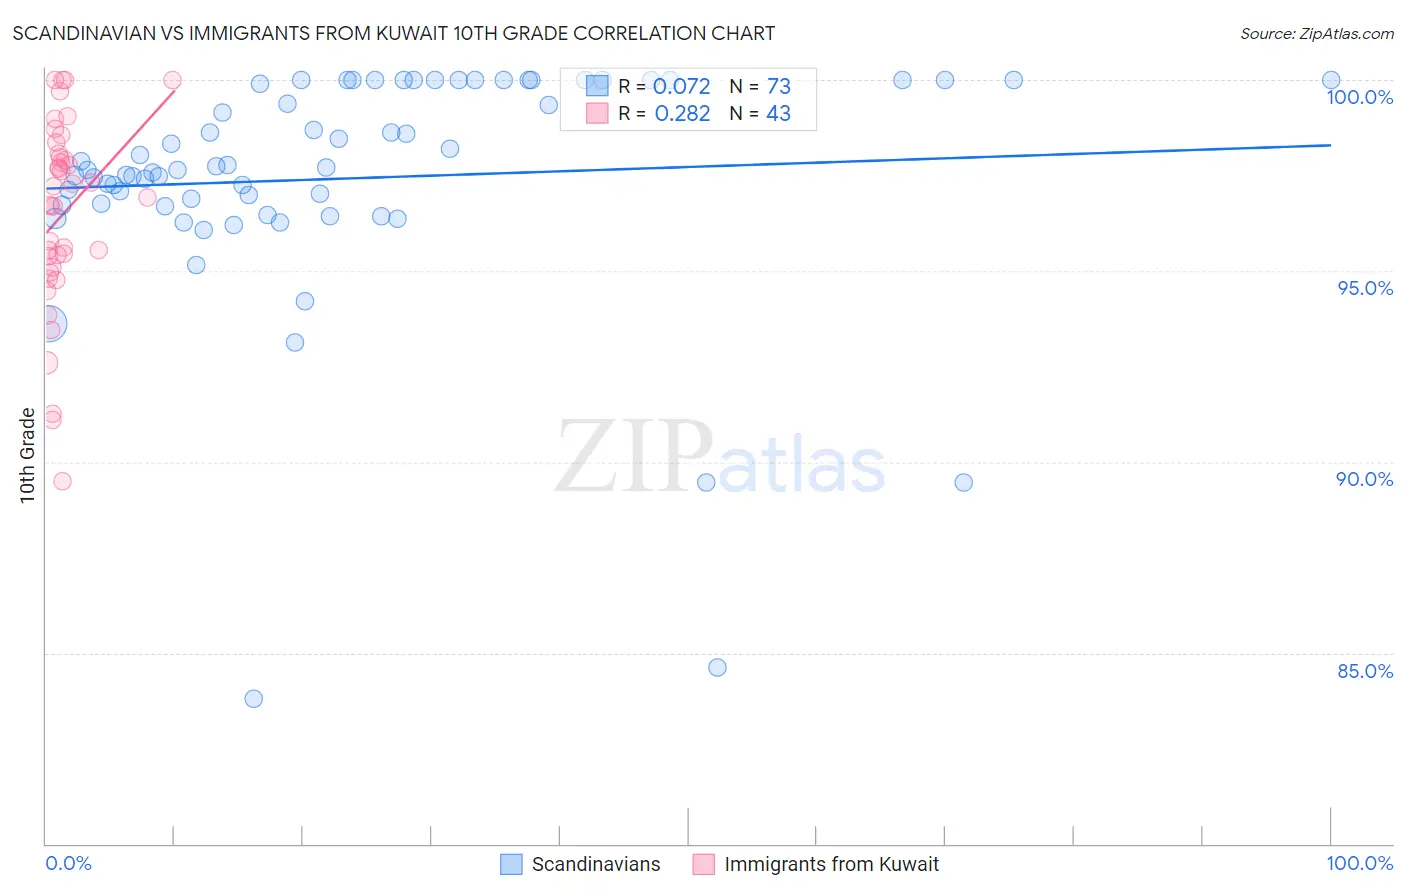
Scandinavian vs Immigrants from Kuwait 10th Grade Correlation Chart
The statistical analysis conducted on geographies consisting of 472,660,435 people shows a slight positive correlation between the proportion of Scandinavians and percentage of population with at least 10th grade education in the United States with a correlation coefficient (R) of 0.072 and weighted average of 95.6%. Similarly, the statistical analysis conducted on geographies consisting of 136,917,085 people shows a weak positive correlation between the proportion of Immigrants from Kuwait and percentage of population with at least 10th grade education in the United States with a correlation coefficient (R) of 0.282 and weighted average of 94.4%, a difference of 1.2%.
10th Grade Correlation Summary
| Measurement | Scandinavian | Immigrants from Kuwait |
| Minimum | 83.8% | 89.5% |
| Maximum | 100.0% | 100.0% |
| Range | 16.2% | 10.5% |
| Mean | 97.4% | 96.5% |
| Median | 97.6% | 96.9% |
| Interquartile 25% (IQ1) | 96.7% | 95.1% |
| Interquartile 75% (IQ3) | 100.0% | 98.1% |
| Interquartile Range (IQR) | 3.3% | 3.0% |
| Standard Deviation (Sample) | 3.1% | 2.5% |
| Standard Deviation (Population) | 3.1% | 2.5% |
Similar Demographics by 10th Grade
Demographics Similar to Scandinavians by 10th Grade
In terms of 10th grade, the demographic groups most similar to Scandinavians are Italian (95.6%, a difference of 0.0%), Latvian (95.6%, a difference of 0.010%), Scottish (95.6%, a difference of 0.020%), Chinese (95.5%, a difference of 0.020%), and Dutch (95.5%, a difference of 0.030%).
| Demographics | Rating | Rank | 10th Grade |
| Tlingit-Haida | 100.0 /100 | #12 | Exceptional 95.7% |
| English | 100.0 /100 | #13 | Exceptional 95.6% |
| Tsimshian | 100.0 /100 | #14 | Exceptional 95.6% |
| Irish | 100.0 /100 | #15 | Exceptional 95.6% |
| Scottish | 100.0 /100 | #16 | Exceptional 95.6% |
| Latvians | 100.0 /100 | #17 | Exceptional 95.6% |
| Italians | 100.0 /100 | #18 | Exceptional 95.6% |
| Scandinavians | 100.0 /100 | #19 | Exceptional 95.6% |
| Chinese | 100.0 /100 | #20 | Exceptional 95.5% |
| Dutch | 100.0 /100 | #21 | Exceptional 95.5% |
| Eastern Europeans | 100.0 /100 | #22 | Exceptional 95.5% |
| Czechs | 100.0 /100 | #23 | Exceptional 95.5% |
| Europeans | 100.0 /100 | #24 | Exceptional 95.5% |
| Maltese | 100.0 /100 | #25 | Exceptional 95.5% |
| Welsh | 100.0 /100 | #26 | Exceptional 95.5% |
Demographics Similar to Immigrants from Kuwait by 10th Grade
In terms of 10th grade, the demographic groups most similar to Immigrants from Kuwait are Immigrants from Zimbabwe (94.4%, a difference of 0.010%), Palestinian (94.4%, a difference of 0.020%), Burmese (94.5%, a difference of 0.030%), German Russian (94.4%, a difference of 0.030%), and Delaware (94.4%, a difference of 0.030%).
| Demographics | Rating | Rank | 10th Grade |
| Immigrants | Turkey | 97.4 /100 | #105 | Exceptional 94.5% |
| Immigrants | Serbia | 97.4 /100 | #106 | Exceptional 94.5% |
| Immigrants | Croatia | 97.4 /100 | #107 | Exceptional 94.5% |
| Immigrants | North Macedonia | 97.2 /100 | #108 | Exceptional 94.5% |
| Immigrants | Norway | 97.2 /100 | #109 | Exceptional 94.5% |
| Burmese | 97.1 /100 | #110 | Exceptional 94.5% |
| Immigrants | Zimbabwe | 96.8 /100 | #111 | Exceptional 94.4% |
| Immigrants | Kuwait | 96.8 /100 | #112 | Exceptional 94.4% |
| Palestinians | 96.5 /100 | #113 | Exceptional 94.4% |
| German Russians | 96.3 /100 | #114 | Exceptional 94.4% |
| Delaware | 96.3 /100 | #115 | Exceptional 94.4% |
| Sioux | 96.2 /100 | #116 | Exceptional 94.4% |
| Immigrants | Hungary | 95.8 /100 | #117 | Exceptional 94.4% |
| Jordanians | 95.6 /100 | #118 | Exceptional 94.4% |
| Immigrants | Israel | 95.4 /100 | #119 | Exceptional 94.4% |