Scandinavian vs Immigrants from Kuwait Male Unemployment
COMPARE
Scandinavian
Immigrants from Kuwait
Male Unemployment
Male Unemployment Comparison
Scandinavians
Immigrants from Kuwait
4.7%
MALE UNEMPLOYMENT
100.0/ 100
METRIC RATING
15th/ 347
METRIC RANK
5.1%
MALE UNEMPLOYMENT
93.3/ 100
METRIC RATING
98th/ 347
METRIC RANK
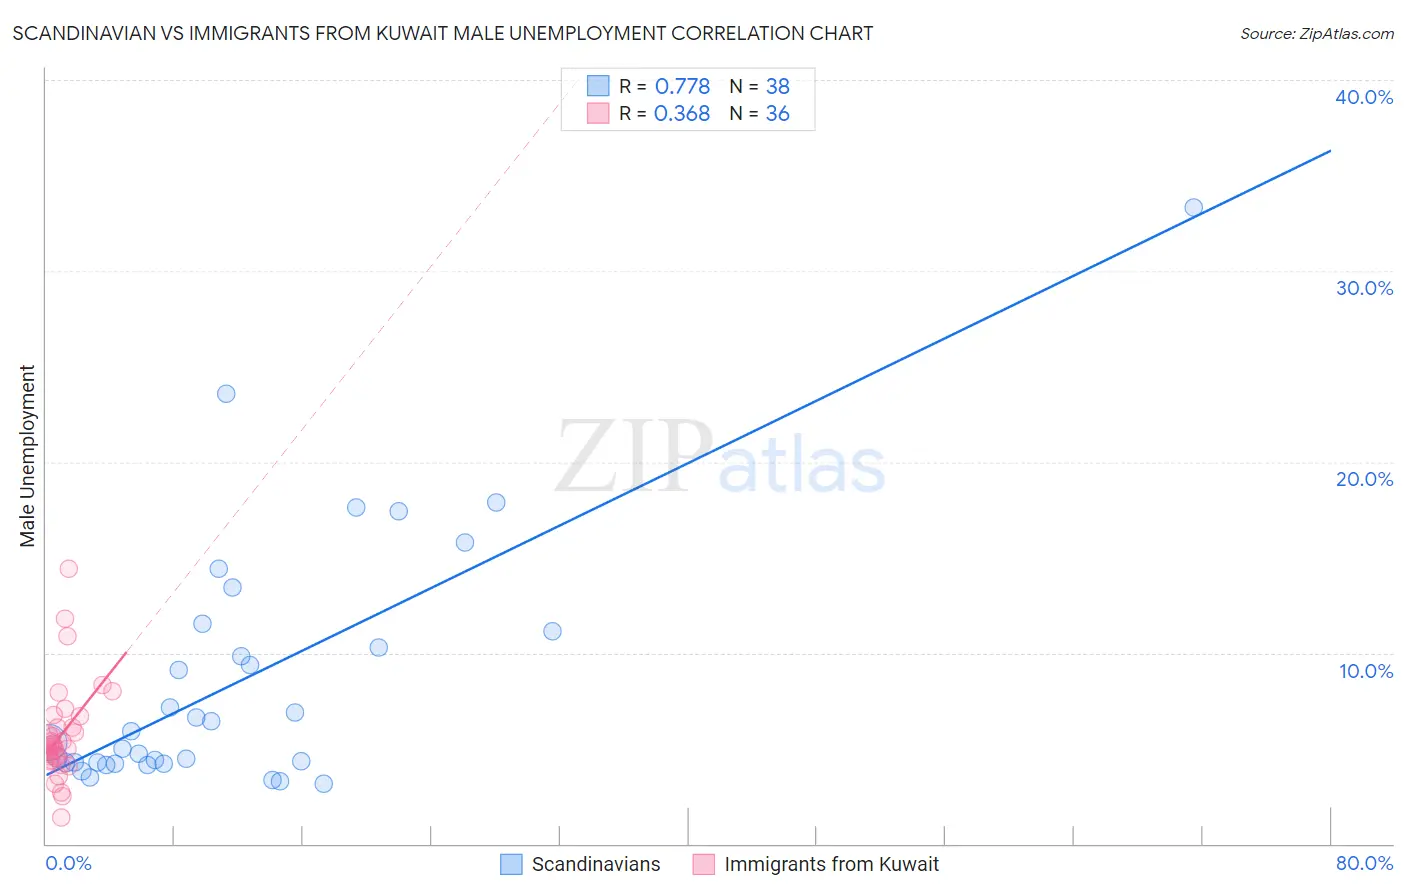
Scandinavian vs Immigrants from Kuwait Male Unemployment Correlation Chart
The statistical analysis conducted on geographies consisting of 467,906,734 people shows a strong positive correlation between the proportion of Scandinavians and unemployment rate among males in the United States with a correlation coefficient (R) of 0.778 and weighted average of 4.7%. Similarly, the statistical analysis conducted on geographies consisting of 136,850,948 people shows a mild positive correlation between the proportion of Immigrants from Kuwait and unemployment rate among males in the United States with a correlation coefficient (R) of 0.368 and weighted average of 5.1%, a difference of 8.2%.
Male Unemployment Correlation Summary
| Measurement | Scandinavian | Immigrants from Kuwait |
| Minimum | 3.1% | 1.4% |
| Maximum | 33.3% | 14.4% |
| Range | 30.2% | 13.0% |
| Mean | 8.6% | 5.7% |
| Median | 5.6% | 5.1% |
| Interquartile 25% (IQ1) | 4.2% | 4.5% |
| Interquartile 75% (IQ3) | 11.1% | 6.4% |
| Interquartile Range (IQR) | 6.9% | 1.9% |
| Standard Deviation (Sample) | 6.6% | 2.5% |
| Standard Deviation (Population) | 6.5% | 2.5% |
Similar Demographics by Male Unemployment
Demographics Similar to Scandinavians by Male Unemployment
In terms of male unemployment, the demographic groups most similar to Scandinavians are Swiss (4.7%, a difference of 0.050%), German (4.7%, a difference of 0.27%), Bolivian (4.7%, a difference of 0.29%), Filipino (4.7%, a difference of 0.78%), and Immigrants from Bolivia (4.7%, a difference of 0.97%).
| Demographics | Rating | Rank | Male Unemployment |
| Luxembourgers | 100.0 /100 | #8 | Exceptional 4.5% |
| Thais | 100.0 /100 | #9 | Exceptional 4.6% |
| Cubans | 100.0 /100 | #10 | Exceptional 4.6% |
| Swedes | 100.0 /100 | #11 | Exceptional 4.6% |
| Immigrants | Bolivia | 100.0 /100 | #12 | Exceptional 4.7% |
| Bolivians | 100.0 /100 | #13 | Exceptional 4.7% |
| Germans | 100.0 /100 | #14 | Exceptional 4.7% |
| Scandinavians | 100.0 /100 | #15 | Exceptional 4.7% |
| Swiss | 99.9 /100 | #16 | Exceptional 4.7% |
| Filipinos | 99.9 /100 | #17 | Exceptional 4.7% |
| English | 99.9 /100 | #18 | Exceptional 4.8% |
| Europeans | 99.9 /100 | #19 | Exceptional 4.8% |
| Pennsylvania Germans | 99.9 /100 | #20 | Exceptional 4.8% |
| Immigrants | Taiwan | 99.9 /100 | #21 | Exceptional 4.8% |
| Carpatho Rusyns | 99.9 /100 | #22 | Exceptional 4.8% |
Demographics Similar to Immigrants from Kuwait by Male Unemployment
In terms of male unemployment, the demographic groups most similar to Immigrants from Kuwait are Immigrants from Spain (5.1%, a difference of 0.040%), Uruguayan (5.1%, a difference of 0.070%), Russian (5.1%, a difference of 0.080%), Asian (5.1%, a difference of 0.11%), and German Russian (5.1%, a difference of 0.12%).
| Demographics | Rating | Rank | Male Unemployment |
| Immigrants | Turkey | 94.4 /100 | #91 | Exceptional 5.1% |
| Slavs | 94.2 /100 | #92 | Exceptional 5.1% |
| Immigrants | Serbia | 94.2 /100 | #93 | Exceptional 5.1% |
| Canadians | 94.1 /100 | #94 | Exceptional 5.1% |
| Italians | 93.8 /100 | #95 | Exceptional 5.1% |
| Asians | 93.7 /100 | #96 | Exceptional 5.1% |
| Immigrants | Spain | 93.4 /100 | #97 | Exceptional 5.1% |
| Immigrants | Kuwait | 93.3 /100 | #98 | Exceptional 5.1% |
| Uruguayans | 93.0 /100 | #99 | Exceptional 5.1% |
| Russians | 92.9 /100 | #100 | Exceptional 5.1% |
| German Russians | 92.7 /100 | #101 | Exceptional 5.1% |
| Immigrants | France | 92.7 /100 | #102 | Exceptional 5.1% |
| Immigrants | Jordan | 91.9 /100 | #103 | Exceptional 5.1% |
| Immigrants | Chile | 91.8 /100 | #104 | Exceptional 5.1% |
| Immigrants | Czechoslovakia | 91.7 /100 | #105 | Exceptional 5.1% |