Puget Sound Salish vs Icelander Male Poverty
COMPARE
Puget Sound Salish
Icelander
Male Poverty
Male Poverty Comparison
Puget Sound Salish
Icelanders
10.7%
MALE POVERTY
84.3/ 100
METRIC RATING
127th/ 347
METRIC RANK
11.0%
MALE POVERTY
68.5/ 100
METRIC RATING
147th/ 347
METRIC RANK
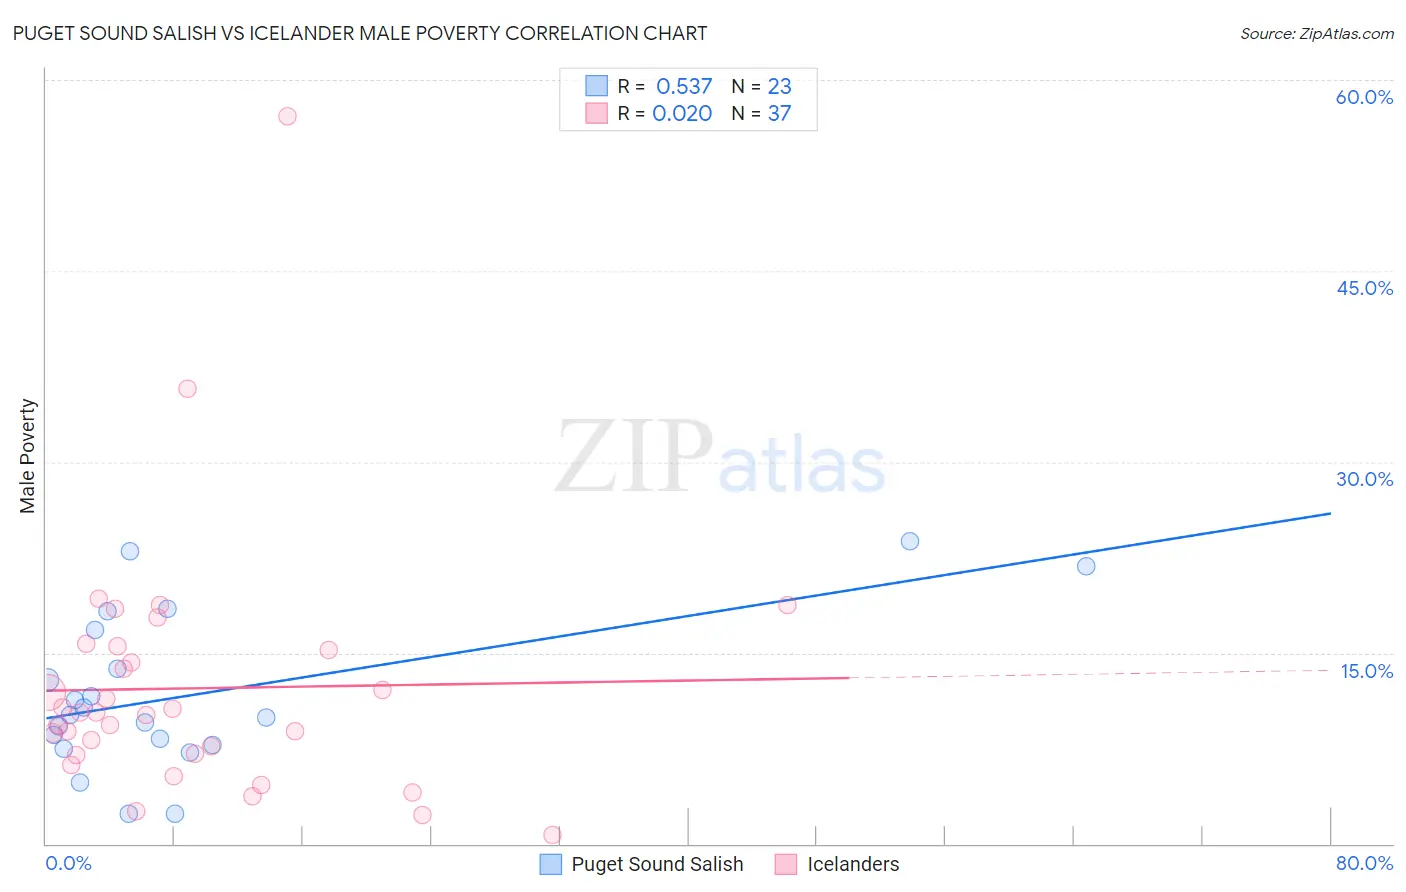
Puget Sound Salish vs Icelander Male Poverty Correlation Chart
The statistical analysis conducted on geographies consisting of 46,147,564 people shows a substantial positive correlation between the proportion of Puget Sound Salish and poverty level among males in the United States with a correlation coefficient (R) of 0.537 and weighted average of 10.7%. Similarly, the statistical analysis conducted on geographies consisting of 159,599,836 people shows no correlation between the proportion of Icelanders and poverty level among males in the United States with a correlation coefficient (R) of 0.020 and weighted average of 11.0%, a difference of 2.3%.
Male Poverty Correlation Summary
| Measurement | Puget Sound Salish | Icelander |
| Minimum | 2.4% | 0.64% |
| Maximum | 23.8% | 57.1% |
| Range | 21.4% | 56.5% |
| Mean | 11.7% | 12.2% |
| Median | 10.1% | 10.3% |
| Interquartile 25% (IQ1) | 7.8% | 7.0% |
| Interquartile 75% (IQ3) | 16.7% | 15.4% |
| Interquartile Range (IQR) | 9.0% | 8.3% |
| Standard Deviation (Sample) | 6.1% | 10.0% |
| Standard Deviation (Population) | 5.9% | 9.8% |
Demographics Similar to Puget Sound Salish and Icelanders by Male Poverty
In terms of male poverty, the demographic groups most similar to Puget Sound Salish are Immigrants from Western Europe (10.7%, a difference of 0.020%), Immigrants from Peru (10.7%, a difference of 0.030%), Chilean (10.7%, a difference of 0.070%), Immigrants from Belarus (10.7%, a difference of 0.18%), and Immigrants from Vietnam (10.8%, a difference of 0.23%). Similarly, the demographic groups most similar to Icelanders are Syrian (10.9%, a difference of 0.34%), Immigrants from Germany (10.9%, a difference of 0.37%), Samoan (10.9%, a difference of 0.39%), Afghan (10.9%, a difference of 0.41%), and Basque (10.9%, a difference of 0.76%).
| Demographics | Rating | Rank | Male Poverty |
| Puget Sound Salish | 84.3 /100 | #127 | Excellent 10.7% |
| Immigrants | Western Europe | 84.2 /100 | #128 | Excellent 10.7% |
| Immigrants | Peru | 84.1 /100 | #129 | Excellent 10.7% |
| Chileans | 83.9 /100 | #130 | Excellent 10.7% |
| Immigrants | Belarus | 83.3 /100 | #131 | Excellent 10.7% |
| Immigrants | Vietnam | 83.0 /100 | #132 | Excellent 10.8% |
| Pakistanis | 83.0 /100 | #133 | Excellent 10.8% |
| New Zealanders | 82.9 /100 | #134 | Excellent 10.8% |
| Brazilians | 82.7 /100 | #135 | Excellent 10.8% |
| Immigrants | Israel | 80.9 /100 | #136 | Excellent 10.8% |
| Immigrants | Switzerland | 79.2 /100 | #137 | Good 10.8% |
| Yugoslavians | 78.2 /100 | #138 | Good 10.8% |
| Immigrants | Jordan | 77.5 /100 | #139 | Good 10.8% |
| Tlingit-Haida | 76.1 /100 | #140 | Good 10.9% |
| Immigrants | France | 75.8 /100 | #141 | Good 10.9% |
| Basques | 74.6 /100 | #142 | Good 10.9% |
| Afghans | 71.9 /100 | #143 | Good 10.9% |
| Samoans | 71.8 /100 | #144 | Good 10.9% |
| Immigrants | Germany | 71.6 /100 | #145 | Good 10.9% |
| Syrians | 71.4 /100 | #146 | Good 10.9% |
| Icelanders | 68.5 /100 | #147 | Good 11.0% |