Swiss vs Icelander Male Poverty
COMPARE
Swiss
Icelander
Male Poverty
Male Poverty Comparison
Swiss
Icelanders
10.2%
MALE POVERTY
97.5/ 100
METRIC RATING
64th/ 347
METRIC RANK
11.0%
MALE POVERTY
68.5/ 100
METRIC RATING
147th/ 347
METRIC RANK
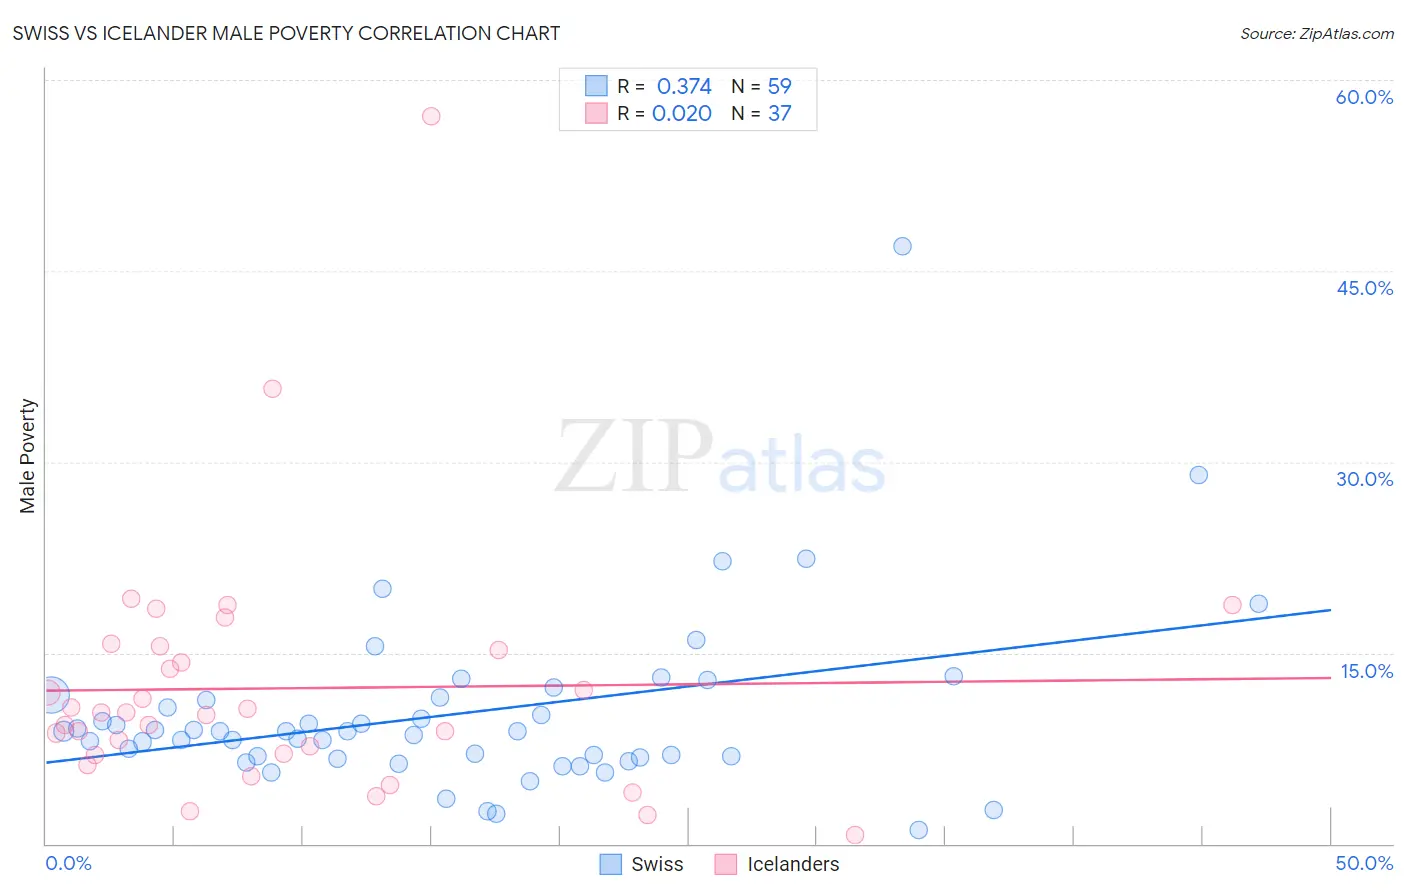
Swiss vs Icelander Male Poverty Correlation Chart
The statistical analysis conducted on geographies consisting of 464,423,995 people shows a mild positive correlation between the proportion of Swiss and poverty level among males in the United States with a correlation coefficient (R) of 0.374 and weighted average of 10.2%. Similarly, the statistical analysis conducted on geographies consisting of 159,599,836 people shows no correlation between the proportion of Icelanders and poverty level among males in the United States with a correlation coefficient (R) of 0.020 and weighted average of 11.0%, a difference of 7.8%.
Male Poverty Correlation Summary
| Measurement | Swiss | Icelander |
| Minimum | 1.1% | 0.64% |
| Maximum | 47.0% | 57.1% |
| Range | 45.9% | 56.5% |
| Mean | 10.2% | 12.2% |
| Median | 8.8% | 10.3% |
| Interquartile 25% (IQ1) | 6.8% | 7.0% |
| Interquartile 75% (IQ3) | 11.4% | 15.4% |
| Interquartile Range (IQR) | 4.7% | 8.3% |
| Standard Deviation (Sample) | 7.0% | 10.0% |
| Standard Deviation (Population) | 6.9% | 9.8% |
Similar Demographics by Male Poverty
Demographics Similar to Swiss by Male Poverty
In terms of male poverty, the demographic groups most similar to Swiss are Zimbabwean (10.2%, a difference of 0.070%), Serbian (10.2%, a difference of 0.080%), Slovak (10.2%, a difference of 0.24%), Immigrants from Netherlands (10.2%, a difference of 0.25%), and Immigrants from Italy (10.2%, a difference of 0.28%).
| Demographics | Rating | Rank | Male Poverty |
| Estonians | 98.1 /100 | #57 | Exceptional 10.1% |
| Scandinavians | 98.0 /100 | #58 | Exceptional 10.1% |
| Immigrants | Europe | 97.9 /100 | #59 | Exceptional 10.1% |
| Ukrainians | 97.9 /100 | #60 | Exceptional 10.1% |
| Austrians | 97.8 /100 | #61 | Exceptional 10.1% |
| Immigrants | Italy | 97.8 /100 | #62 | Exceptional 10.2% |
| Slovaks | 97.7 /100 | #63 | Exceptional 10.2% |
| Swiss | 97.5 /100 | #64 | Exceptional 10.2% |
| Zimbabweans | 97.5 /100 | #65 | Exceptional 10.2% |
| Serbians | 97.5 /100 | #66 | Exceptional 10.2% |
| Immigrants | Netherlands | 97.3 /100 | #67 | Exceptional 10.2% |
| Immigrants | Sri Lanka | 97.2 /100 | #68 | Exceptional 10.2% |
| Immigrants | Australia | 97.1 /100 | #69 | Exceptional 10.2% |
| Paraguayans | 97.1 /100 | #70 | Exceptional 10.2% |
| Europeans | 97.1 /100 | #71 | Exceptional 10.2% |
Demographics Similar to Icelanders by Male Poverty
In terms of male poverty, the demographic groups most similar to Icelanders are Armenian (11.0%, a difference of 0.050%), Immigrants from Venezuela (11.0%, a difference of 0.070%), Guamanian/Chamorro (11.0%, a difference of 0.11%), Venezuelan (11.0%, a difference of 0.13%), and Immigrants from Nepal (11.0%, a difference of 0.14%).
| Demographics | Rating | Rank | Male Poverty |
| Tlingit-Haida | 76.1 /100 | #140 | Good 10.9% |
| Immigrants | France | 75.8 /100 | #141 | Good 10.9% |
| Basques | 74.6 /100 | #142 | Good 10.9% |
| Afghans | 71.9 /100 | #143 | Good 10.9% |
| Samoans | 71.8 /100 | #144 | Good 10.9% |
| Immigrants | Germany | 71.6 /100 | #145 | Good 10.9% |
| Syrians | 71.4 /100 | #146 | Good 10.9% |
| Icelanders | 68.5 /100 | #147 | Good 11.0% |
| Armenians | 68.0 /100 | #148 | Good 11.0% |
| Immigrants | Venezuela | 67.9 /100 | #149 | Good 11.0% |
| Guamanians/Chamorros | 67.6 /100 | #150 | Good 11.0% |
| Venezuelans | 67.4 /100 | #151 | Good 11.0% |
| Immigrants | Nepal | 67.3 /100 | #152 | Good 11.0% |
| Immigrants | Bosnia and Herzegovina | 65.2 /100 | #153 | Good 11.0% |
| Immigrants | Kazakhstan | 64.8 /100 | #154 | Good 11.0% |