Puget Sound Salish vs Macedonian Male Poverty
COMPARE
Puget Sound Salish
Macedonian
Male Poverty
Male Poverty Comparison
Puget Sound Salish
Macedonians
10.7%
MALE POVERTY
84.3/ 100
METRIC RATING
127th/ 347
METRIC RANK
9.7%
MALE POVERTY
99.5/ 100
METRIC RATING
32nd/ 347
METRIC RANK
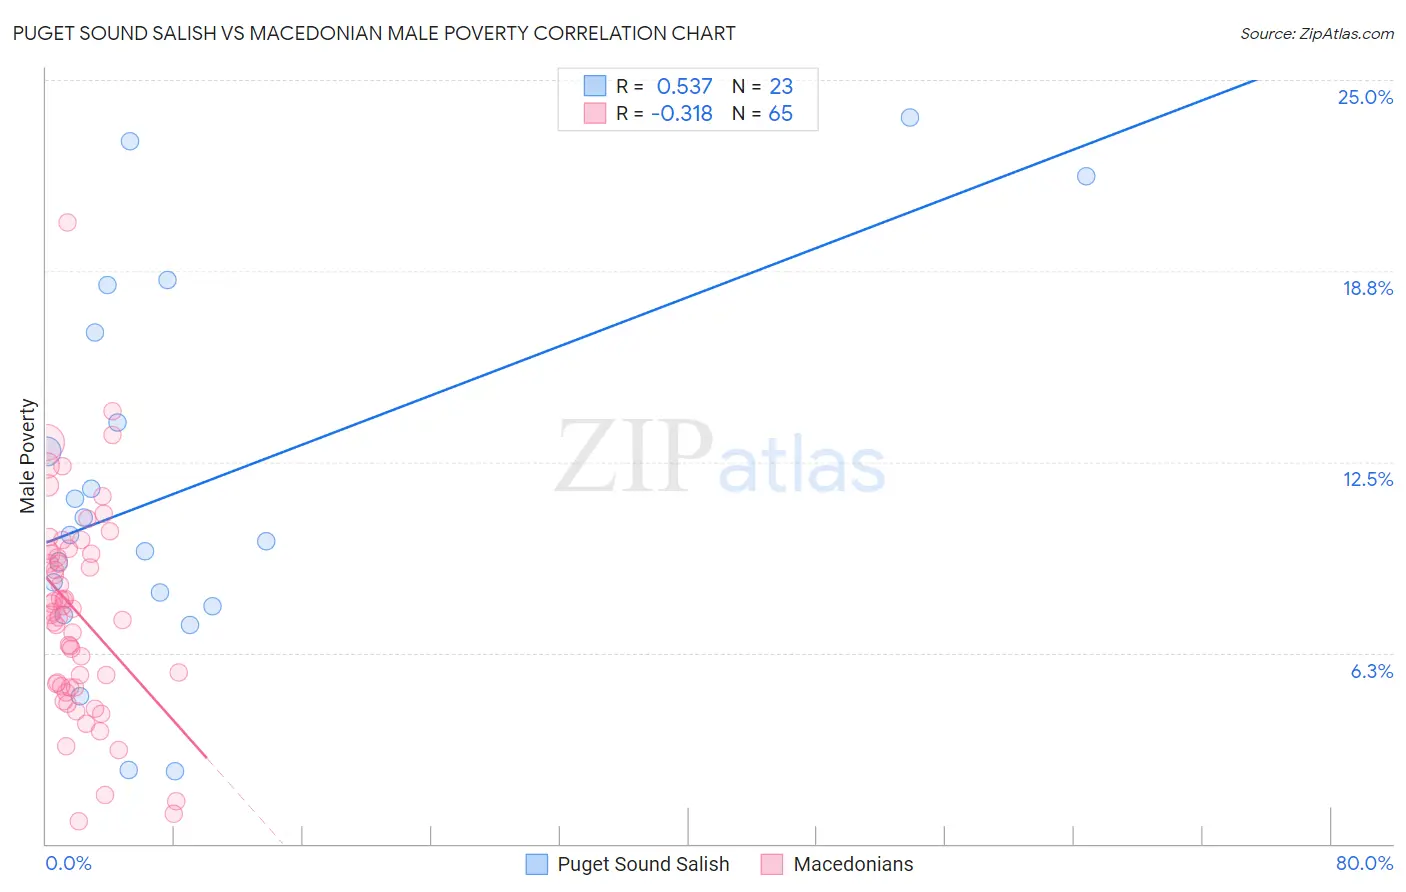
Puget Sound Salish vs Macedonian Male Poverty Correlation Chart
The statistical analysis conducted on geographies consisting of 46,147,564 people shows a substantial positive correlation between the proportion of Puget Sound Salish and poverty level among males in the United States with a correlation coefficient (R) of 0.537 and weighted average of 10.7%. Similarly, the statistical analysis conducted on geographies consisting of 132,583,851 people shows a mild negative correlation between the proportion of Macedonians and poverty level among males in the United States with a correlation coefficient (R) of -0.318 and weighted average of 9.7%, a difference of 10.2%.
Male Poverty Correlation Summary
| Measurement | Puget Sound Salish | Macedonian |
| Minimum | 2.4% | 0.75% |
| Maximum | 23.8% | 20.3% |
| Range | 21.4% | 19.6% |
| Mean | 11.7% | 7.6% |
| Median | 10.1% | 7.6% |
| Interquartile 25% (IQ1) | 7.8% | 5.1% |
| Interquartile 75% (IQ3) | 16.7% | 9.5% |
| Interquartile Range (IQR) | 9.0% | 4.4% |
| Standard Deviation (Sample) | 6.1% | 3.4% |
| Standard Deviation (Population) | 5.9% | 3.4% |
Similar Demographics by Male Poverty
Demographics Similar to Puget Sound Salish by Male Poverty
In terms of male poverty, the demographic groups most similar to Puget Sound Salish are Immigrants from Ukraine (10.7%, a difference of 0.0%), Immigrants from Western Europe (10.7%, a difference of 0.020%), Immigrants from Peru (10.7%, a difference of 0.030%), Chilean (10.7%, a difference of 0.070%), and Immigrants from Belarus (10.7%, a difference of 0.18%).
| Demographics | Rating | Rank | Male Poverty |
| Immigrants | China | 87.1 /100 | #120 | Excellent 10.7% |
| Peruvians | 87.1 /100 | #121 | Excellent 10.7% |
| Native Hawaiians | 87.0 /100 | #122 | Excellent 10.7% |
| South Africans | 86.8 /100 | #123 | Excellent 10.7% |
| French | 86.7 /100 | #124 | Excellent 10.7% |
| Immigrants | Norway | 86.0 /100 | #125 | Excellent 10.7% |
| Immigrants | Ukraine | 84.3 /100 | #126 | Excellent 10.7% |
| Puget Sound Salish | 84.3 /100 | #127 | Excellent 10.7% |
| Immigrants | Western Europe | 84.2 /100 | #128 | Excellent 10.7% |
| Immigrants | Peru | 84.1 /100 | #129 | Excellent 10.7% |
| Chileans | 83.9 /100 | #130 | Excellent 10.7% |
| Immigrants | Belarus | 83.3 /100 | #131 | Excellent 10.7% |
| Immigrants | Vietnam | 83.0 /100 | #132 | Excellent 10.8% |
| Pakistanis | 83.0 /100 | #133 | Excellent 10.8% |
| New Zealanders | 82.9 /100 | #134 | Excellent 10.8% |
Demographics Similar to Macedonians by Male Poverty
In terms of male poverty, the demographic groups most similar to Macedonians are Immigrants from Northern Europe (9.7%, a difference of 0.090%), Tongan (9.7%, a difference of 0.21%), Polish (9.7%, a difference of 0.23%), Immigrants from Poland (9.8%, a difference of 0.23%), and Greek (9.7%, a difference of 0.30%).
| Demographics | Rating | Rank | Male Poverty |
| Eastern Europeans | 99.6 /100 | #25 | Exceptional 9.6% |
| Burmese | 99.6 /100 | #26 | Exceptional 9.7% |
| Danes | 99.6 /100 | #27 | Exceptional 9.7% |
| Immigrants | Korea | 99.6 /100 | #28 | Exceptional 9.7% |
| Greeks | 99.6 /100 | #29 | Exceptional 9.7% |
| Poles | 99.5 /100 | #30 | Exceptional 9.7% |
| Tongans | 99.5 /100 | #31 | Exceptional 9.7% |
| Macedonians | 99.5 /100 | #32 | Exceptional 9.7% |
| Immigrants | Northern Europe | 99.5 /100 | #33 | Exceptional 9.7% |
| Immigrants | Poland | 99.5 /100 | #34 | Exceptional 9.8% |
| Iranians | 99.4 /100 | #35 | Exceptional 9.8% |
| Czechs | 99.4 /100 | #36 | Exceptional 9.8% |
| Immigrants | Greece | 99.3 /100 | #37 | Exceptional 9.8% |
| Immigrants | Pakistan | 99.2 /100 | #38 | Exceptional 9.9% |
| Russians | 99.2 /100 | #39 | Exceptional 9.9% |