Puget Sound Salish vs Immigrants from the Azores Male Poverty
COMPARE
Puget Sound Salish
Immigrants from the Azores
Male Poverty
Male Poverty Comparison
Puget Sound Salish
Immigrants from the Azores
10.7%
MALE POVERTY
84.3/ 100
METRIC RATING
127th/ 347
METRIC RANK
12.0%
MALE POVERTY
4.3/ 100
METRIC RATING
209th/ 347
METRIC RANK
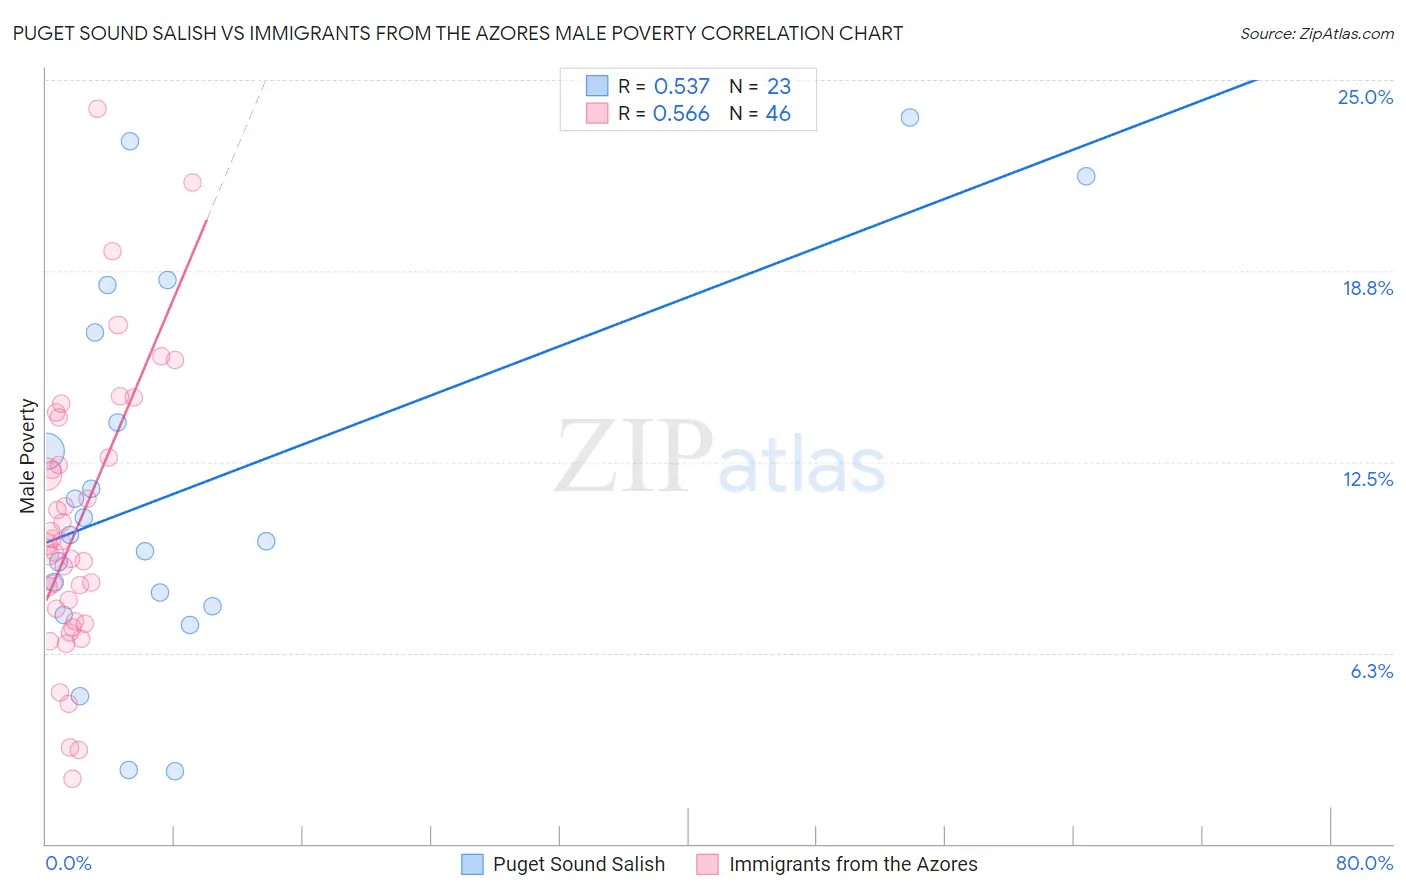
Puget Sound Salish vs Immigrants from the Azores Male Poverty Correlation Chart
The statistical analysis conducted on geographies consisting of 46,147,564 people shows a substantial positive correlation between the proportion of Puget Sound Salish and poverty level among males in the United States with a correlation coefficient (R) of 0.537 and weighted average of 10.7%. Similarly, the statistical analysis conducted on geographies consisting of 46,252,452 people shows a substantial positive correlation between the proportion of Immigrants from the Azores and poverty level among males in the United States with a correlation coefficient (R) of 0.566 and weighted average of 12.0%, a difference of 12.2%.
Male Poverty Correlation Summary
| Measurement | Puget Sound Salish | Immigrants from the Azores |
| Minimum | 2.4% | 2.1% |
| Maximum | 23.8% | 24.1% |
| Range | 21.4% | 21.9% |
| Mean | 11.7% | 10.5% |
| Median | 10.1% | 9.7% |
| Interquartile 25% (IQ1) | 7.8% | 7.3% |
| Interquartile 75% (IQ3) | 16.7% | 12.7% |
| Interquartile Range (IQR) | 9.0% | 5.4% |
| Standard Deviation (Sample) | 6.1% | 4.6% |
| Standard Deviation (Population) | 5.9% | 4.5% |
Similar Demographics by Male Poverty
Demographics Similar to Puget Sound Salish by Male Poverty
In terms of male poverty, the demographic groups most similar to Puget Sound Salish are Immigrants from Ukraine (10.7%, a difference of 0.0%), Immigrants from Western Europe (10.7%, a difference of 0.020%), Immigrants from Peru (10.7%, a difference of 0.030%), Chilean (10.7%, a difference of 0.070%), and Immigrants from Belarus (10.7%, a difference of 0.18%).
| Demographics | Rating | Rank | Male Poverty |
| Immigrants | China | 87.1 /100 | #120 | Excellent 10.7% |
| Peruvians | 87.1 /100 | #121 | Excellent 10.7% |
| Native Hawaiians | 87.0 /100 | #122 | Excellent 10.7% |
| South Africans | 86.8 /100 | #123 | Excellent 10.7% |
| French | 86.7 /100 | #124 | Excellent 10.7% |
| Immigrants | Norway | 86.0 /100 | #125 | Excellent 10.7% |
| Immigrants | Ukraine | 84.3 /100 | #126 | Excellent 10.7% |
| Puget Sound Salish | 84.3 /100 | #127 | Excellent 10.7% |
| Immigrants | Western Europe | 84.2 /100 | #128 | Excellent 10.7% |
| Immigrants | Peru | 84.1 /100 | #129 | Excellent 10.7% |
| Chileans | 83.9 /100 | #130 | Excellent 10.7% |
| Immigrants | Belarus | 83.3 /100 | #131 | Excellent 10.7% |
| Immigrants | Vietnam | 83.0 /100 | #132 | Excellent 10.8% |
| Pakistanis | 83.0 /100 | #133 | Excellent 10.8% |
| New Zealanders | 82.9 /100 | #134 | Excellent 10.8% |
Demographics Similar to Immigrants from the Azores by Male Poverty
In terms of male poverty, the demographic groups most similar to Immigrants from the Azores are Moroccan (12.0%, a difference of 0.050%), Immigrants (12.0%, a difference of 0.12%), Immigrants from Panama (12.1%, a difference of 0.17%), Malaysian (12.0%, a difference of 0.44%), and Immigrants from Eastern Africa (12.0%, a difference of 0.54%).
| Demographics | Rating | Rank | Male Poverty |
| Aleuts | 10.4 /100 | #202 | Poor 11.8% |
| Immigrants | Western Asia | 9.8 /100 | #203 | Tragic 11.8% |
| Immigrants | Uganda | 8.5 /100 | #204 | Tragic 11.8% |
| Panamanians | 6.2 /100 | #205 | Tragic 11.9% |
| Immigrants | Eastern Africa | 5.4 /100 | #206 | Tragic 12.0% |
| Malaysians | 5.2 /100 | #207 | Tragic 12.0% |
| Immigrants | Immigrants | 4.5 /100 | #208 | Tragic 12.0% |
| Immigrants | Azores | 4.3 /100 | #209 | Tragic 12.0% |
| Moroccans | 4.2 /100 | #210 | Tragic 12.0% |
| Immigrants | Panama | 4.0 /100 | #211 | Tragic 12.1% |
| Americans | 3.2 /100 | #212 | Tragic 12.1% |
| Immigrants | Nonimmigrants | 3.1 /100 | #213 | Tragic 12.1% |
| Japanese | 2.7 /100 | #214 | Tragic 12.2% |
| Immigrants | Uzbekistan | 2.6 /100 | #215 | Tragic 12.2% |
| Immigrants | Cambodia | 2.5 /100 | #216 | Tragic 12.2% |