Puget Sound Salish vs Icelander Female Disability
COMPARE
Puget Sound Salish
Icelander
Female Disability
Female Disability Comparison
Puget Sound Salish
Icelanders
13.8%
FEMALE DISABILITY
0.0/ 100
METRIC RATING
314th/ 347
METRIC RANK
12.0%
FEMALE DISABILITY
80.7/ 100
METRIC RATING
151st/ 347
METRIC RANK
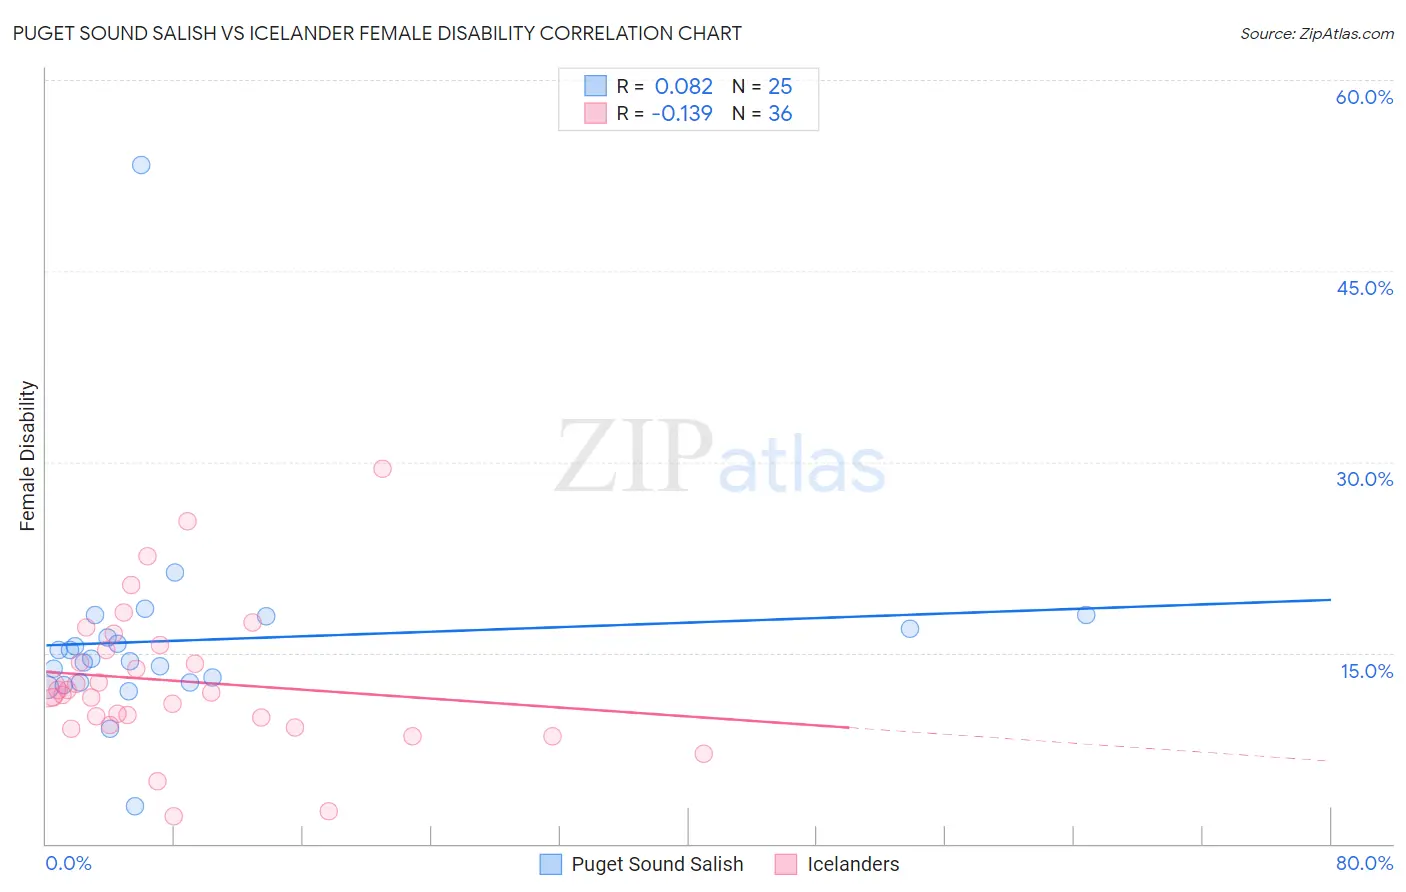
Puget Sound Salish vs Icelander Female Disability Correlation Chart
The statistical analysis conducted on geographies consisting of 46,152,398 people shows a slight positive correlation between the proportion of Puget Sound Salish and percentage of females with a disability in the United States with a correlation coefficient (R) of 0.082 and weighted average of 13.8%. Similarly, the statistical analysis conducted on geographies consisting of 159,642,732 people shows a poor negative correlation between the proportion of Icelanders and percentage of females with a disability in the United States with a correlation coefficient (R) of -0.139 and weighted average of 12.0%, a difference of 15.1%.
Female Disability Correlation Summary
| Measurement | Puget Sound Salish | Icelander |
| Minimum | 2.9% | 2.2% |
| Maximum | 53.3% | 29.5% |
| Range | 50.4% | 27.3% |
| Mean | 16.0% | 12.8% |
| Median | 14.5% | 12.0% |
| Interquartile 25% (IQ1) | 12.6% | 9.6% |
| Interquartile 75% (IQ3) | 17.4% | 15.4% |
| Interquartile Range (IQR) | 4.7% | 5.8% |
| Standard Deviation (Sample) | 8.5% | 5.7% |
| Standard Deviation (Population) | 8.4% | 5.6% |
Similar Demographics by Female Disability
Demographics Similar to Puget Sound Salish by Female Disability
In terms of female disability, the demographic groups most similar to Puget Sound Salish are Blackfeet (13.8%, a difference of 0.10%), Delaware (13.8%, a difference of 0.42%), Alaskan Athabascan (13.9%, a difference of 0.59%), Hopi (13.7%, a difference of 0.73%), and Spanish American (14.0%, a difference of 0.95%).
| Demographics | Rating | Rank | Female Disability |
| Central American Indians | 0.0 /100 | #307 | Tragic 13.6% |
| Cree | 0.0 /100 | #308 | Tragic 13.7% |
| French American Indians | 0.0 /100 | #309 | Tragic 13.7% |
| Apache | 0.0 /100 | #310 | Tragic 13.7% |
| Hopi | 0.0 /100 | #311 | Tragic 13.7% |
| Delaware | 0.0 /100 | #312 | Tragic 13.8% |
| Blackfeet | 0.0 /100 | #313 | Tragic 13.8% |
| Puget Sound Salish | 0.0 /100 | #314 | Tragic 13.8% |
| Alaskan Athabascans | 0.0 /100 | #315 | Tragic 13.9% |
| Spanish Americans | 0.0 /100 | #316 | Tragic 14.0% |
| Chippewa | 0.0 /100 | #317 | Tragic 14.0% |
| Paiute | 0.0 /100 | #318 | Tragic 14.0% |
| Iroquois | 0.0 /100 | #319 | Tragic 14.0% |
| Americans | 0.0 /100 | #320 | Tragic 14.1% |
| Potawatomi | 0.0 /100 | #321 | Tragic 14.1% |
Demographics Similar to Icelanders by Female Disability
In terms of female disability, the demographic groups most similar to Icelanders are Immigrants from Moldova (12.0%, a difference of 0.040%), Greek (12.0%, a difference of 0.080%), Immigrants from Scotland (12.0%, a difference of 0.090%), Sudanese (12.0%, a difference of 0.090%), and Immigrants from Kenya (12.0%, a difference of 0.15%).
| Demographics | Rating | Rank | Female Disability |
| Immigrants | Austria | 87.9 /100 | #144 | Excellent 12.0% |
| Estonians | 87.8 /100 | #145 | Excellent 12.0% |
| Pakistanis | 84.6 /100 | #146 | Excellent 12.0% |
| Nigerians | 84.0 /100 | #147 | Excellent 12.0% |
| Immigrants | Kenya | 83.1 /100 | #148 | Excellent 12.0% |
| Greeks | 82.0 /100 | #149 | Excellent 12.0% |
| Immigrants | Moldova | 81.4 /100 | #150 | Excellent 12.0% |
| Icelanders | 80.7 /100 | #151 | Excellent 12.0% |
| Immigrants | Scotland | 79.3 /100 | #152 | Good 12.0% |
| Sudanese | 79.1 /100 | #153 | Good 12.0% |
| Syrians | 76.9 /100 | #154 | Good 12.1% |
| Ghanaians | 76.6 /100 | #155 | Good 12.1% |
| Moroccans | 72.9 /100 | #156 | Good 12.1% |
| Danes | 72.5 /100 | #157 | Good 12.1% |
| Immigrants | Middle Africa | 72.4 /100 | #158 | Good 12.1% |