Puerto Rican vs Bahamian Single Female Poverty
COMPARE
Puerto Rican
Bahamian
Single Female Poverty
Single Female Poverty Comparison
Puerto Ricans
Bahamians
34.1%
SINGLE FEMALE POVERTY
0.0/ 100
METRIC RATING
346th/ 347
METRIC RANK
22.7%
SINGLE FEMALE POVERTY
0.6/ 100
METRIC RATING
258th/ 347
METRIC RANK
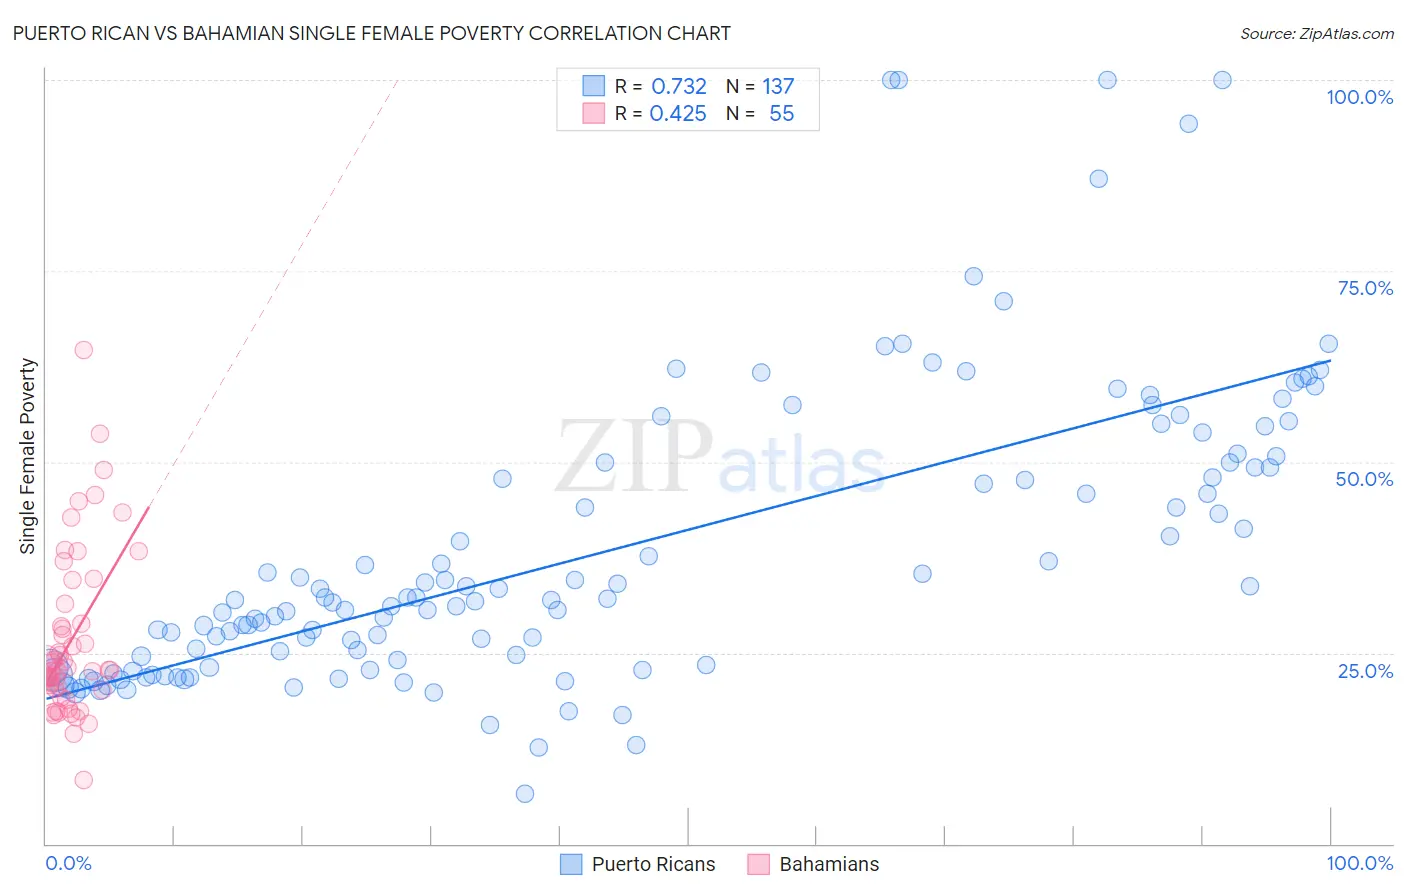
Puerto Rican vs Bahamian Single Female Poverty Correlation Chart
The statistical analysis conducted on geographies consisting of 515,297,886 people shows a strong positive correlation between the proportion of Puerto Ricans and poverty level among single females in the United States with a correlation coefficient (R) of 0.732 and weighted average of 34.1%. Similarly, the statistical analysis conducted on geographies consisting of 112,361,785 people shows a moderate positive correlation between the proportion of Bahamians and poverty level among single females in the United States with a correlation coefficient (R) of 0.425 and weighted average of 22.7%, a difference of 50.4%.
Single Female Poverty Correlation Summary
| Measurement | Puerto Rican | Bahamian |
| Minimum | 6.5% | 8.3% |
| Maximum | 100.0% | 64.6% |
| Range | 93.5% | 56.3% |
| Mean | 38.4% | 26.7% |
| Median | 31.9% | 22.7% |
| Interquartile 25% (IQ1) | 23.2% | 20.2% |
| Interquartile 75% (IQ3) | 49.9% | 31.5% |
| Interquartile Range (IQR) | 26.7% | 11.3% |
| Standard Deviation (Sample) | 19.4% | 10.9% |
| Standard Deviation (Population) | 19.3% | 10.8% |
Similar Demographics by Single Female Poverty
Demographics Similar to Puerto Ricans by Single Female Poverty
In terms of single female poverty, the demographic groups most similar to Puerto Ricans are Tohono O'odham (34.2%, a difference of 0.30%), Houma (33.8%, a difference of 0.92%), Lumbee (33.0%, a difference of 3.3%), Crow (32.4%, a difference of 5.2%), and Navajo (31.7%, a difference of 7.7%).
| Demographics | Rating | Rank | Single Female Poverty |
| Ute | 0.0 /100 | #333 | Tragic 28.4% |
| Pueblo | 0.0 /100 | #334 | Tragic 28.6% |
| Immigrants | Yemen | 0.0 /100 | #335 | Tragic 28.9% |
| Colville | 0.0 /100 | #336 | Tragic 29.1% |
| Yuman | 0.0 /100 | #337 | Tragic 29.4% |
| Pima | 0.0 /100 | #338 | Tragic 30.3% |
| Cheyenne | 0.0 /100 | #339 | Tragic 30.4% |
| Cajuns | 0.0 /100 | #340 | Tragic 30.6% |
| Sioux | 0.0 /100 | #341 | Tragic 31.3% |
| Navajo | 0.0 /100 | #342 | Tragic 31.7% |
| Crow | 0.0 /100 | #343 | Tragic 32.4% |
| Lumbee | 0.0 /100 | #344 | Tragic 33.0% |
| Houma | 0.0 /100 | #345 | Tragic 33.8% |
| Puerto Ricans | 0.0 /100 | #346 | Tragic 34.1% |
| Tohono O'odham | 0.0 /100 | #347 | Tragic 34.2% |
Demographics Similar to Bahamians by Single Female Poverty
In terms of single female poverty, the demographic groups most similar to Bahamians are White/Caucasian (22.7%, a difference of 0.14%), Sudanese (22.6%, a difference of 0.20%), Celtic (22.7%, a difference of 0.21%), Immigrants from Belize (22.6%, a difference of 0.34%), and Immigrants from Cabo Verde (22.8%, a difference of 0.48%).
| Demographics | Rating | Rank | Single Female Poverty |
| Immigrants | West Indies | 1.0 /100 | #251 | Tragic 22.5% |
| Delaware | 1.0 /100 | #252 | Tragic 22.5% |
| Immigrants | Liberia | 0.9 /100 | #253 | Tragic 22.5% |
| Immigrants | Burma/Myanmar | 0.8 /100 | #254 | Tragic 22.6% |
| Immigrants | Sudan | 0.8 /100 | #255 | Tragic 22.6% |
| Immigrants | Belize | 0.8 /100 | #256 | Tragic 22.6% |
| Sudanese | 0.7 /100 | #257 | Tragic 22.6% |
| Bahamians | 0.6 /100 | #258 | Tragic 22.7% |
| Whites/Caucasians | 0.6 /100 | #259 | Tragic 22.7% |
| Celtics | 0.5 /100 | #260 | Tragic 22.7% |
| Immigrants | Cabo Verde | 0.4 /100 | #261 | Tragic 22.8% |
| British West Indians | 0.4 /100 | #262 | Tragic 22.8% |
| Scotch-Irish | 0.3 /100 | #263 | Tragic 22.9% |
| Immigrants | Laos | 0.3 /100 | #264 | Tragic 22.9% |
| Central Americans | 0.2 /100 | #265 | Tragic 23.0% |