Immigrants from Japan vs Bahamian Single Female Poverty
COMPARE
Immigrants from Japan
Bahamian
Single Female Poverty
Single Female Poverty Comparison
Immigrants from Japan
Bahamians
18.6%
SINGLE FEMALE POVERTY
99.9/ 100
METRIC RATING
35th/ 347
METRIC RANK
22.7%
SINGLE FEMALE POVERTY
0.6/ 100
METRIC RATING
258th/ 347
METRIC RANK
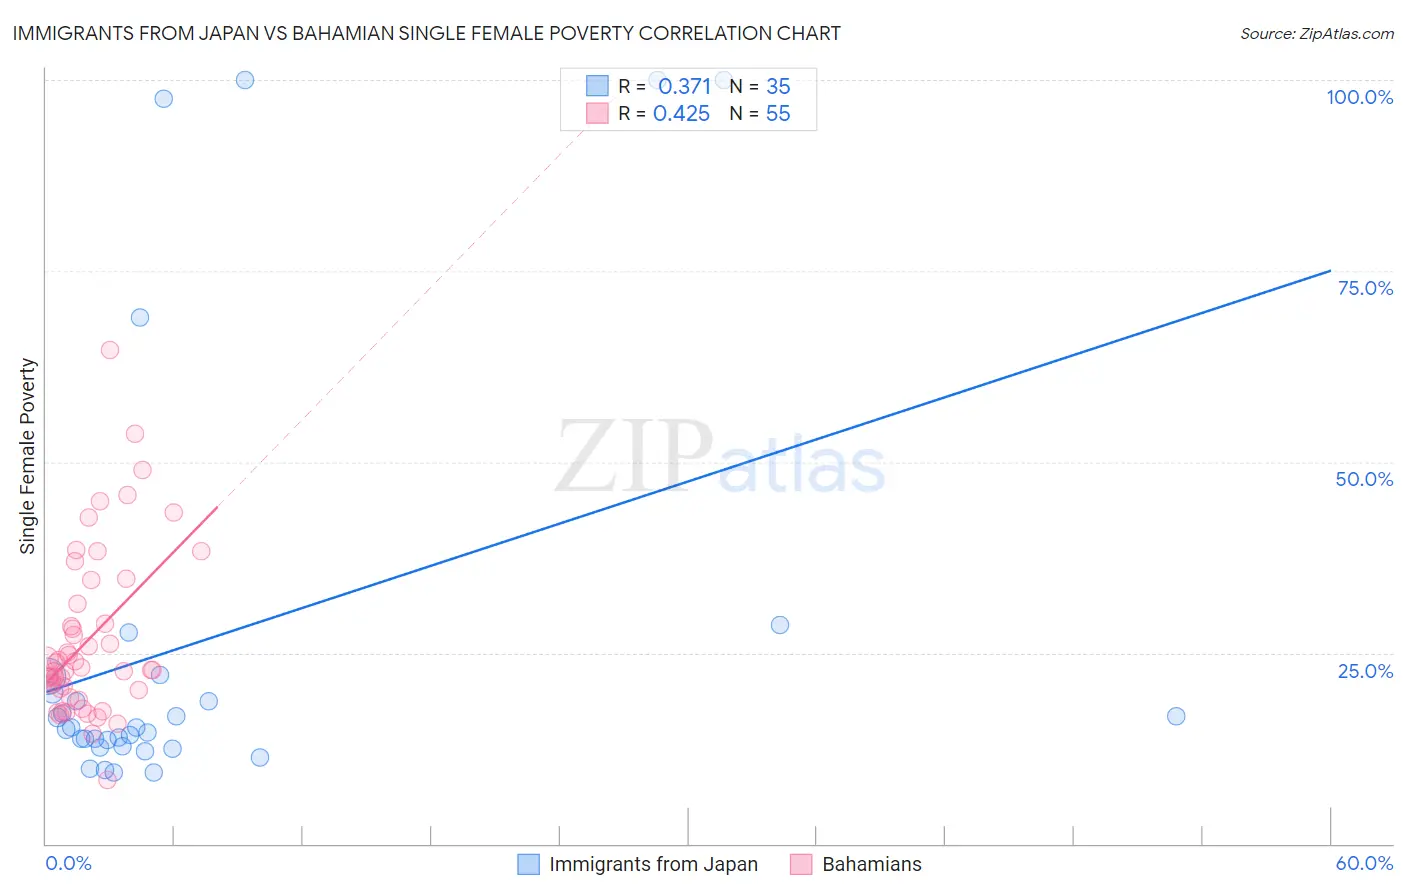
Immigrants from Japan vs Bahamian Single Female Poverty Correlation Chart
The statistical analysis conducted on geographies consisting of 335,522,478 people shows a mild positive correlation between the proportion of Immigrants from Japan and poverty level among single females in the United States with a correlation coefficient (R) of 0.371 and weighted average of 18.6%. Similarly, the statistical analysis conducted on geographies consisting of 112,361,785 people shows a moderate positive correlation between the proportion of Bahamians and poverty level among single females in the United States with a correlation coefficient (R) of 0.425 and weighted average of 22.7%, a difference of 21.7%.
Single Female Poverty Correlation Summary
| Measurement | Immigrants from Japan | Bahamian |
| Minimum | 9.4% | 8.3% |
| Maximum | 100.0% | 64.6% |
| Range | 90.6% | 56.3% |
| Mean | 26.7% | 26.7% |
| Median | 15.1% | 22.7% |
| Interquartile 25% (IQ1) | 12.8% | 20.2% |
| Interquartile 75% (IQ3) | 21.9% | 31.5% |
| Interquartile Range (IQR) | 9.2% | 11.3% |
| Standard Deviation (Sample) | 28.3% | 10.9% |
| Standard Deviation (Population) | 27.9% | 10.8% |
Similar Demographics by Single Female Poverty
Demographics Similar to Immigrants from Japan by Single Female Poverty
In terms of single female poverty, the demographic groups most similar to Immigrants from Japan are Korean (18.6%, a difference of 0.060%), Turkish (18.7%, a difference of 0.18%), Immigrants from Armenia (18.7%, a difference of 0.20%), Immigrants from Philippines (18.6%, a difference of 0.24%), and Immigrants from Sri Lanka (18.6%, a difference of 0.30%).
| Demographics | Rating | Rank | Single Female Poverty |
| Immigrants | Moldova | 100.0 /100 | #28 | Exceptional 18.5% |
| Immigrants | Poland | 100.0 /100 | #29 | Exceptional 18.5% |
| Immigrants | North Macedonia | 99.9 /100 | #30 | Exceptional 18.5% |
| Immigrants | Asia | 99.9 /100 | #31 | Exceptional 18.6% |
| Immigrants | Sri Lanka | 99.9 /100 | #32 | Exceptional 18.6% |
| Immigrants | Philippines | 99.9 /100 | #33 | Exceptional 18.6% |
| Koreans | 99.9 /100 | #34 | Exceptional 18.6% |
| Immigrants | Japan | 99.9 /100 | #35 | Exceptional 18.6% |
| Turks | 99.9 /100 | #36 | Exceptional 18.7% |
| Immigrants | Armenia | 99.9 /100 | #37 | Exceptional 18.7% |
| Tongans | 99.9 /100 | #38 | Exceptional 18.8% |
| Bulgarians | 99.9 /100 | #39 | Exceptional 18.8% |
| Okinawans | 99.9 /100 | #40 | Exceptional 18.8% |
| Immigrants | Serbia | 99.9 /100 | #41 | Exceptional 18.8% |
| Jordanians | 99.9 /100 | #42 | Exceptional 18.8% |
Demographics Similar to Bahamians by Single Female Poverty
In terms of single female poverty, the demographic groups most similar to Bahamians are White/Caucasian (22.7%, a difference of 0.14%), Sudanese (22.6%, a difference of 0.20%), Celtic (22.7%, a difference of 0.21%), Immigrants from Belize (22.6%, a difference of 0.34%), and Immigrants from Cabo Verde (22.8%, a difference of 0.48%).
| Demographics | Rating | Rank | Single Female Poverty |
| Immigrants | West Indies | 1.0 /100 | #251 | Tragic 22.5% |
| Delaware | 1.0 /100 | #252 | Tragic 22.5% |
| Immigrants | Liberia | 0.9 /100 | #253 | Tragic 22.5% |
| Immigrants | Burma/Myanmar | 0.8 /100 | #254 | Tragic 22.6% |
| Immigrants | Sudan | 0.8 /100 | #255 | Tragic 22.6% |
| Immigrants | Belize | 0.8 /100 | #256 | Tragic 22.6% |
| Sudanese | 0.7 /100 | #257 | Tragic 22.6% |
| Bahamians | 0.6 /100 | #258 | Tragic 22.7% |
| Whites/Caucasians | 0.6 /100 | #259 | Tragic 22.7% |
| Celtics | 0.5 /100 | #260 | Tragic 22.7% |
| Immigrants | Cabo Verde | 0.4 /100 | #261 | Tragic 22.8% |
| British West Indians | 0.4 /100 | #262 | Tragic 22.8% |
| Scotch-Irish | 0.3 /100 | #263 | Tragic 22.9% |
| Immigrants | Laos | 0.3 /100 | #264 | Tragic 22.9% |
| Central Americans | 0.2 /100 | #265 | Tragic 23.0% |