Marshallese vs Bahamian Single Female Poverty
COMPARE
Marshallese
Bahamian
Single Female Poverty
Single Female Poverty Comparison
Marshallese
Bahamians
23.3%
SINGLE FEMALE POVERTY
0.1/ 100
METRIC RATING
274th/ 347
METRIC RANK
22.7%
SINGLE FEMALE POVERTY
0.6/ 100
METRIC RATING
258th/ 347
METRIC RANK
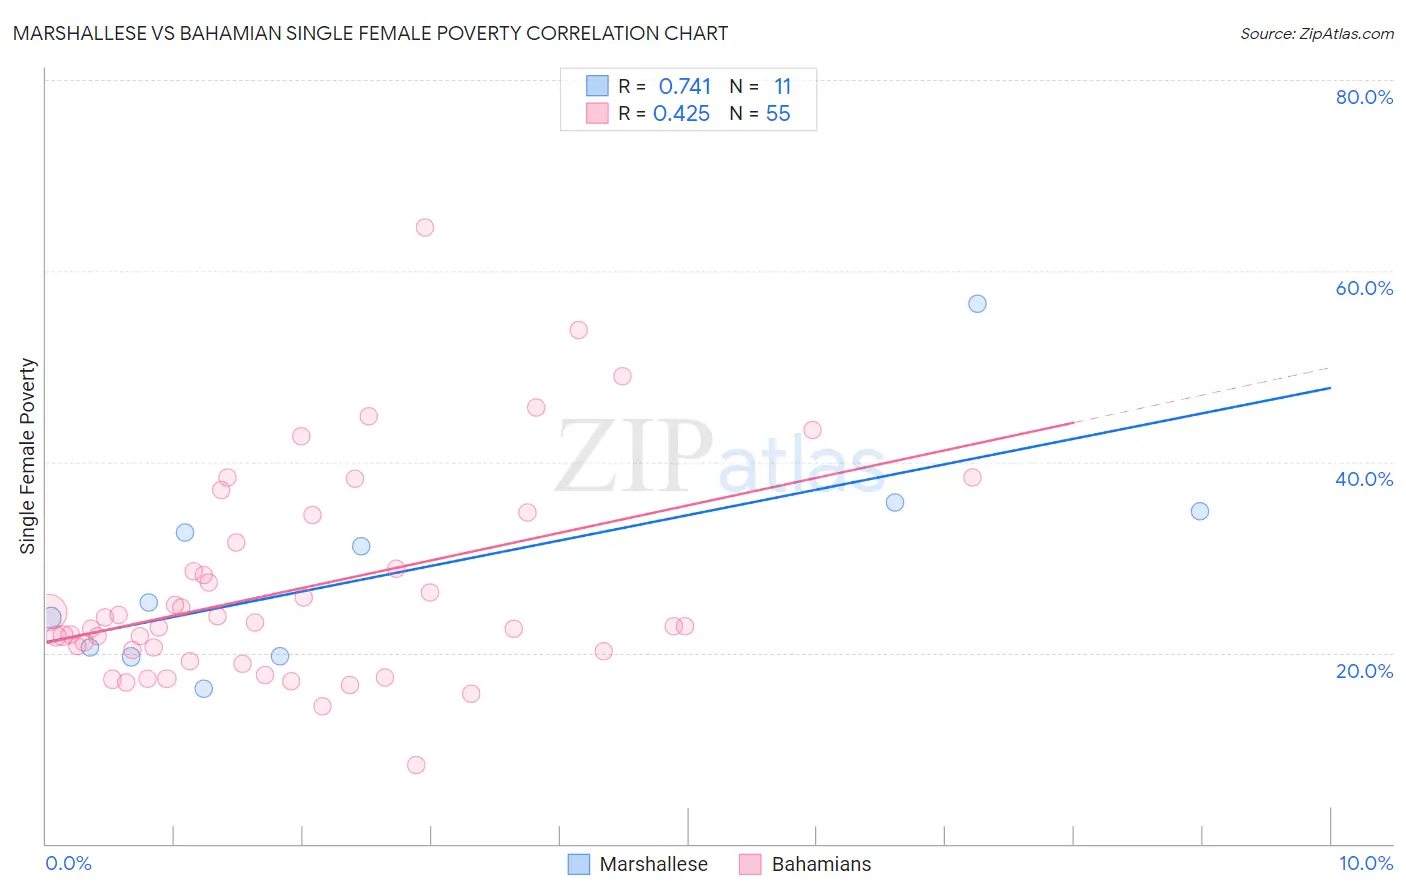
Marshallese vs Bahamian Single Female Poverty Correlation Chart
The statistical analysis conducted on geographies consisting of 14,727,549 people shows a strong positive correlation between the proportion of Marshallese and poverty level among single females in the United States with a correlation coefficient (R) of 0.741 and weighted average of 23.3%. Similarly, the statistical analysis conducted on geographies consisting of 112,361,785 people shows a moderate positive correlation between the proportion of Bahamians and poverty level among single females in the United States with a correlation coefficient (R) of 0.425 and weighted average of 22.7%, a difference of 2.7%.
Single Female Poverty Correlation Summary
| Measurement | Marshallese | Bahamian |
| Minimum | 16.2% | 8.3% |
| Maximum | 56.5% | 64.6% |
| Range | 40.3% | 56.3% |
| Mean | 28.7% | 26.7% |
| Median | 25.2% | 22.7% |
| Interquartile 25% (IQ1) | 19.6% | 20.2% |
| Interquartile 75% (IQ3) | 34.8% | 31.5% |
| Interquartile Range (IQR) | 15.2% | 11.3% |
| Standard Deviation (Sample) | 11.4% | 10.9% |
| Standard Deviation (Population) | 10.9% | 10.8% |
Demographics Similar to Marshallese and Bahamians by Single Female Poverty
In terms of single female poverty, the demographic groups most similar to Marshallese are Alaska Native (23.3%, a difference of 0.010%), Immigrants from Senegal (23.2%, a difference of 0.26%), Mexican American Indian (23.4%, a difference of 0.27%), Subsaharan African (23.2%, a difference of 0.45%), and Inupiat (23.1%, a difference of 0.69%). Similarly, the demographic groups most similar to Bahamians are White/Caucasian (22.7%, a difference of 0.14%), Sudanese (22.6%, a difference of 0.20%), Celtic (22.7%, a difference of 0.21%), Immigrants from Belize (22.6%, a difference of 0.34%), and Immigrants from Cabo Verde (22.8%, a difference of 0.48%).
| Demographics | Rating | Rank | Single Female Poverty |
| Immigrants | Belize | 0.8 /100 | #256 | Tragic 22.6% |
| Sudanese | 0.7 /100 | #257 | Tragic 22.6% |
| Bahamians | 0.6 /100 | #258 | Tragic 22.7% |
| Whites/Caucasians | 0.6 /100 | #259 | Tragic 22.7% |
| Celtics | 0.5 /100 | #260 | Tragic 22.7% |
| Immigrants | Cabo Verde | 0.4 /100 | #261 | Tragic 22.8% |
| British West Indians | 0.4 /100 | #262 | Tragic 22.8% |
| Scotch-Irish | 0.3 /100 | #263 | Tragic 22.9% |
| Immigrants | Laos | 0.3 /100 | #264 | Tragic 22.9% |
| Central Americans | 0.2 /100 | #265 | Tragic 23.0% |
| Immigrants | Micronesia | 0.2 /100 | #266 | Tragic 23.0% |
| Senegalese | 0.2 /100 | #267 | Tragic 23.0% |
| Fijians | 0.2 /100 | #268 | Tragic 23.1% |
| Hmong | 0.2 /100 | #269 | Tragic 23.1% |
| Inupiat | 0.2 /100 | #270 | Tragic 23.1% |
| Sub-Saharan Africans | 0.1 /100 | #271 | Tragic 23.2% |
| Immigrants | Senegal | 0.1 /100 | #272 | Tragic 23.2% |
| Alaska Natives | 0.1 /100 | #273 | Tragic 23.3% |
| Marshallese | 0.1 /100 | #274 | Tragic 23.3% |
| Mexican American Indians | 0.1 /100 | #275 | Tragic 23.4% |
| Immigrants | Azores | 0.0 /100 | #276 | Tragic 23.5% |