Mexican vs Bahamian Single Female Poverty
COMPARE
Mexican
Bahamian
Single Female Poverty
Single Female Poverty Comparison
Mexicans
Bahamians
25.0%
SINGLE FEMALE POVERTY
0.0/ 100
METRIC RATING
299th/ 347
METRIC RANK
22.7%
SINGLE FEMALE POVERTY
0.6/ 100
METRIC RATING
258th/ 347
METRIC RANK
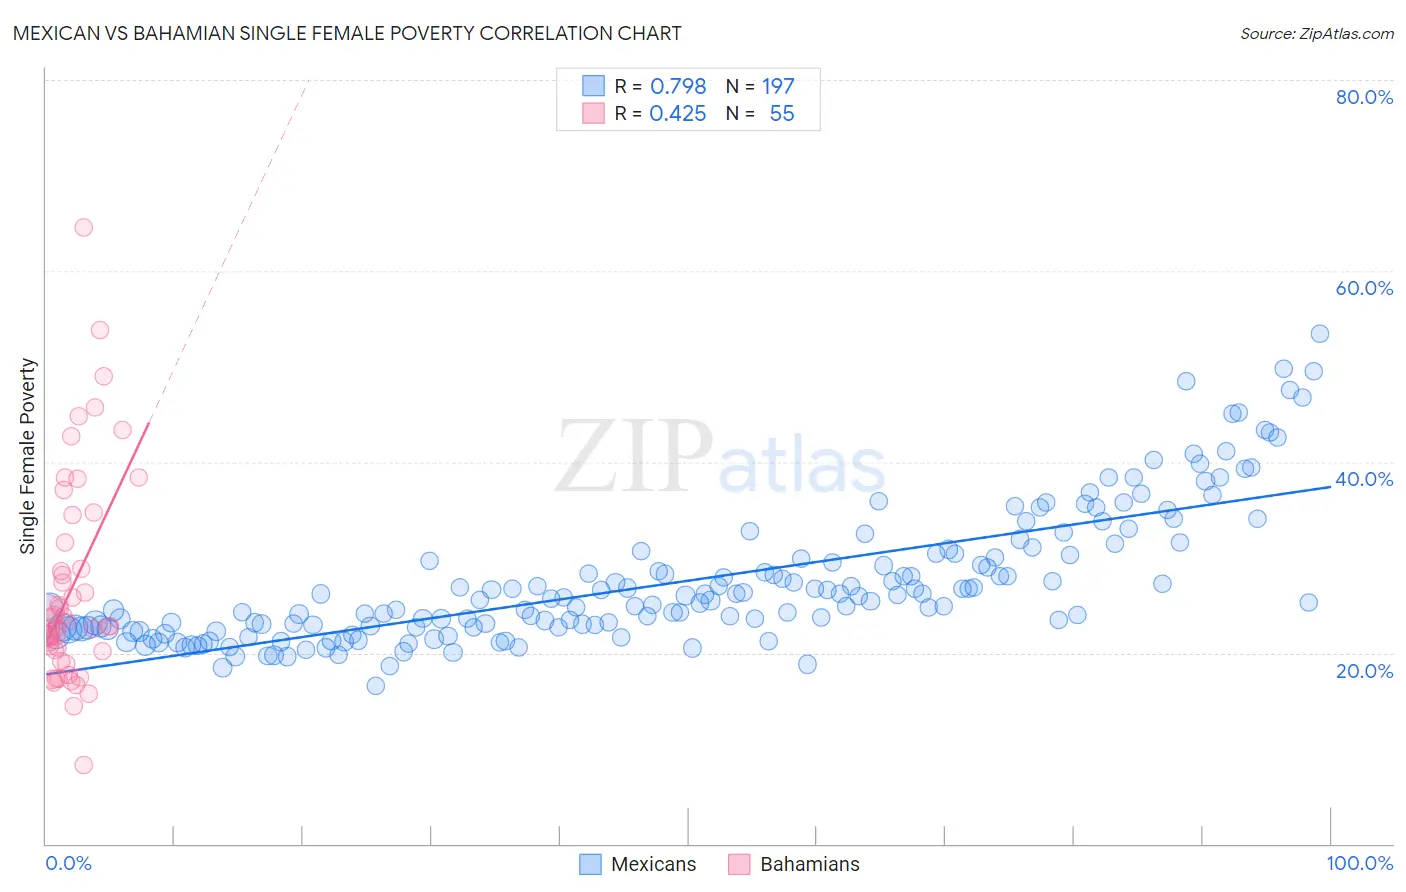
Mexican vs Bahamian Single Female Poverty Correlation Chart
The statistical analysis conducted on geographies consisting of 547,731,472 people shows a strong positive correlation between the proportion of Mexicans and poverty level among single females in the United States with a correlation coefficient (R) of 0.798 and weighted average of 25.0%. Similarly, the statistical analysis conducted on geographies consisting of 112,361,785 people shows a moderate positive correlation between the proportion of Bahamians and poverty level among single females in the United States with a correlation coefficient (R) of 0.425 and weighted average of 22.7%, a difference of 10.4%.
Single Female Poverty Correlation Summary
| Measurement | Mexican | Bahamian |
| Minimum | 16.6% | 8.3% |
| Maximum | 53.5% | 64.6% |
| Range | 36.9% | 56.3% |
| Mean | 27.4% | 26.7% |
| Median | 25.5% | 22.7% |
| Interquartile 25% (IQ1) | 22.6% | 20.2% |
| Interquartile 75% (IQ3) | 30.1% | 31.5% |
| Interquartile Range (IQR) | 7.5% | 11.3% |
| Standard Deviation (Sample) | 7.0% | 10.9% |
| Standard Deviation (Population) | 7.0% | 10.8% |
Similar Demographics by Single Female Poverty
Demographics Similar to Mexicans by Single Female Poverty
In terms of single female poverty, the demographic groups most similar to Mexicans are Blackfeet (25.1%, a difference of 0.080%), Honduran (25.1%, a difference of 0.25%), Shoshone (25.1%, a difference of 0.34%), Yaqui (24.9%, a difference of 0.67%), and Somali (25.2%, a difference of 0.74%).
| Demographics | Rating | Rank | Single Female Poverty |
| Alsatians | 0.0 /100 | #292 | Tragic 24.5% |
| Americans | 0.0 /100 | #293 | Tragic 24.5% |
| French American Indians | 0.0 /100 | #294 | Tragic 24.6% |
| Hispanics or Latinos | 0.0 /100 | #295 | Tragic 24.6% |
| Africans | 0.0 /100 | #296 | Tragic 24.8% |
| Immigrants | Central America | 0.0 /100 | #297 | Tragic 24.8% |
| Yaqui | 0.0 /100 | #298 | Tragic 24.9% |
| Mexicans | 0.0 /100 | #299 | Tragic 25.0% |
| Blackfeet | 0.0 /100 | #300 | Tragic 25.1% |
| Hondurans | 0.0 /100 | #301 | Tragic 25.1% |
| Shoshone | 0.0 /100 | #302 | Tragic 25.1% |
| Somalis | 0.0 /100 | #303 | Tragic 25.2% |
| Immigrants | Congo | 0.0 /100 | #304 | Tragic 25.3% |
| Immigrants | Dominican Republic | 0.0 /100 | #305 | Tragic 25.3% |
| Immigrants | Mexico | 0.0 /100 | #306 | Tragic 25.3% |
Demographics Similar to Bahamians by Single Female Poverty
In terms of single female poverty, the demographic groups most similar to Bahamians are White/Caucasian (22.7%, a difference of 0.14%), Sudanese (22.6%, a difference of 0.20%), Celtic (22.7%, a difference of 0.21%), Immigrants from Belize (22.6%, a difference of 0.34%), and Immigrants from Cabo Verde (22.8%, a difference of 0.48%).
| Demographics | Rating | Rank | Single Female Poverty |
| Immigrants | West Indies | 1.0 /100 | #251 | Tragic 22.5% |
| Delaware | 1.0 /100 | #252 | Tragic 22.5% |
| Immigrants | Liberia | 0.9 /100 | #253 | Tragic 22.5% |
| Immigrants | Burma/Myanmar | 0.8 /100 | #254 | Tragic 22.6% |
| Immigrants | Sudan | 0.8 /100 | #255 | Tragic 22.6% |
| Immigrants | Belize | 0.8 /100 | #256 | Tragic 22.6% |
| Sudanese | 0.7 /100 | #257 | Tragic 22.6% |
| Bahamians | 0.6 /100 | #258 | Tragic 22.7% |
| Whites/Caucasians | 0.6 /100 | #259 | Tragic 22.7% |
| Celtics | 0.5 /100 | #260 | Tragic 22.7% |
| Immigrants | Cabo Verde | 0.4 /100 | #261 | Tragic 22.8% |
| British West Indians | 0.4 /100 | #262 | Tragic 22.8% |
| Scotch-Irish | 0.3 /100 | #263 | Tragic 22.9% |
| Immigrants | Laos | 0.3 /100 | #264 | Tragic 22.9% |
| Central Americans | 0.2 /100 | #265 | Tragic 23.0% |