Puerto Rican vs Bahamian 6th Grade
COMPARE
Puerto Rican
Bahamian
6th Grade
6th Grade Comparison
Puerto Ricans
Bahamians
95.5%
6TH GRADE
0.0/ 100
METRIC RATING
309th/ 347
METRIC RANK
96.7%
6TH GRADE
4.8/ 100
METRIC RATING
223rd/ 347
METRIC RANK
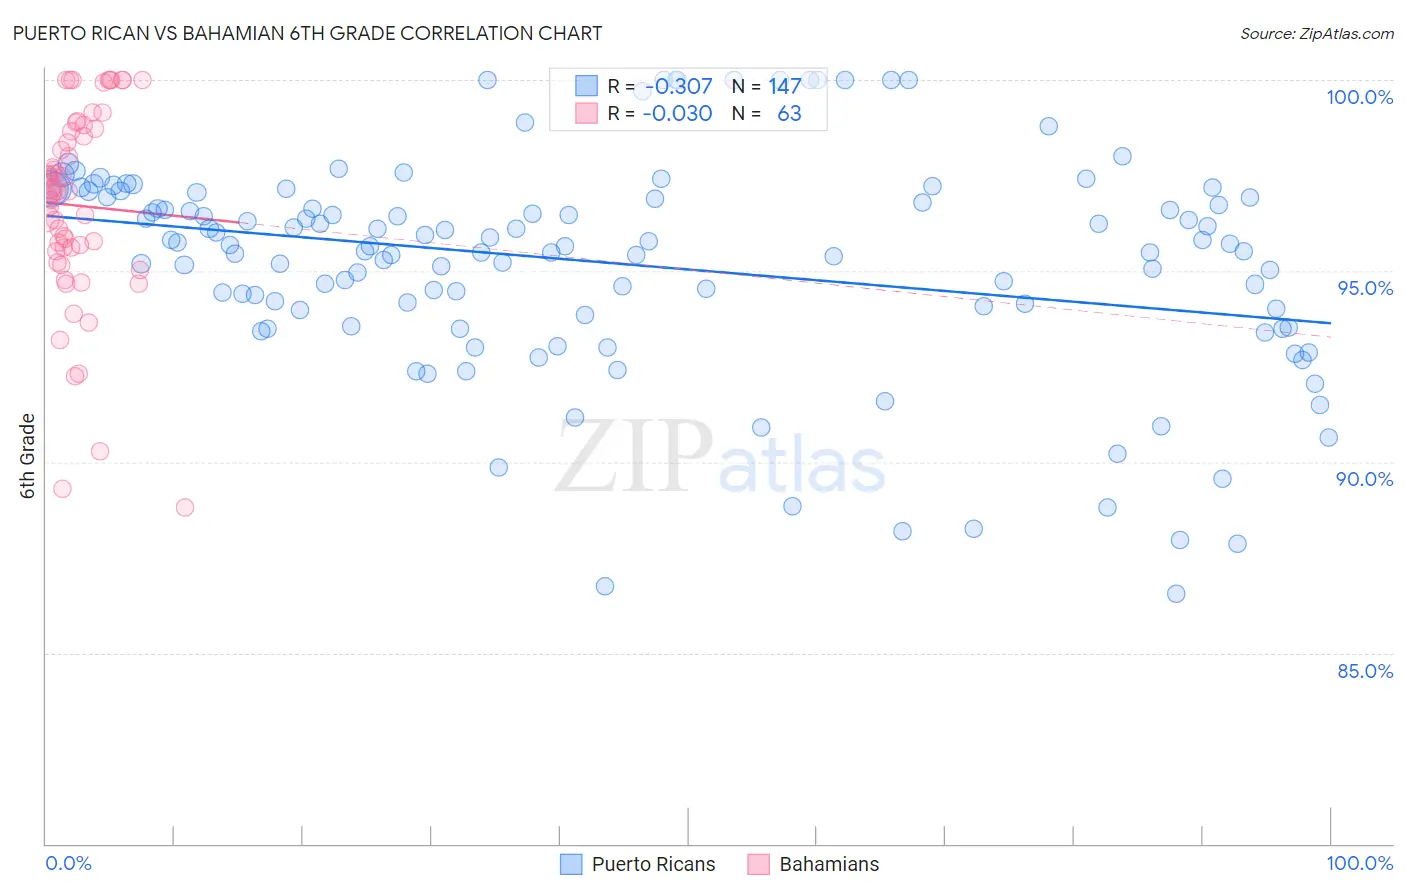
Puerto Rican vs Bahamian 6th Grade Correlation Chart
The statistical analysis conducted on geographies consisting of 528,320,438 people shows a mild negative correlation between the proportion of Puerto Ricans and percentage of population with at least 6th grade education in the United States with a correlation coefficient (R) of -0.307 and weighted average of 95.5%. Similarly, the statistical analysis conducted on geographies consisting of 112,698,819 people shows no correlation between the proportion of Bahamians and percentage of population with at least 6th grade education in the United States with a correlation coefficient (R) of -0.030 and weighted average of 96.7%, a difference of 1.3%.
6th Grade Correlation Summary
| Measurement | Puerto Rican | Bahamian |
| Minimum | 86.6% | 88.8% |
| Maximum | 100.0% | 100.0% |
| Range | 13.4% | 11.2% |
| Mean | 95.2% | 96.7% |
| Median | 95.7% | 97.1% |
| Interquartile 25% (IQ1) | 93.8% | 95.5% |
| Interquartile 75% (IQ3) | 96.9% | 98.7% |
| Interquartile Range (IQR) | 3.1% | 3.2% |
| Standard Deviation (Sample) | 2.9% | 2.6% |
| Standard Deviation (Population) | 2.8% | 2.6% |
Similar Demographics by 6th Grade
Demographics Similar to Puerto Ricans by 6th Grade
In terms of 6th grade, the demographic groups most similar to Puerto Ricans are Ecuadorian (95.5%, a difference of 0.010%), Immigrants from Portugal (95.5%, a difference of 0.030%), Immigrants from Guyana (95.5%, a difference of 0.040%), Immigrants from Caribbean (95.6%, a difference of 0.050%), and Guyanese (95.6%, a difference of 0.060%).
| Demographics | Rating | Rank | 6th Grade |
| Immigrants | Burma/Myanmar | 0.0 /100 | #302 | Tragic 95.7% |
| Bangladeshis | 0.0 /100 | #303 | Tragic 95.7% |
| Indonesians | 0.0 /100 | #304 | Tragic 95.6% |
| Immigrants | Cuba | 0.0 /100 | #305 | Tragic 95.6% |
| Immigrants | Haiti | 0.0 /100 | #306 | Tragic 95.6% |
| Guyanese | 0.0 /100 | #307 | Tragic 95.6% |
| Immigrants | Caribbean | 0.0 /100 | #308 | Tragic 95.6% |
| Puerto Ricans | 0.0 /100 | #309 | Tragic 95.5% |
| Ecuadorians | 0.0 /100 | #310 | Tragic 95.5% |
| Immigrants | Portugal | 0.0 /100 | #311 | Tragic 95.5% |
| Immigrants | Guyana | 0.0 /100 | #312 | Tragic 95.5% |
| Nicaraguans | 0.0 /100 | #313 | Tragic 95.4% |
| Immigrants | Vietnam | 0.0 /100 | #314 | Tragic 95.4% |
| Immigrants | Bangladesh | 0.0 /100 | #315 | Tragic 95.4% |
| Japanese | 0.0 /100 | #316 | Tragic 95.4% |
Demographics Similar to Bahamians by 6th Grade
In terms of 6th grade, the demographic groups most similar to Bahamians are Immigrants from Southern Europe (96.7%, a difference of 0.010%), Immigrants from Pakistan (96.7%, a difference of 0.010%), Immigrants from Panama (96.7%, a difference of 0.010%), Immigrants from Western Asia (96.7%, a difference of 0.020%), and Immigrants from Malaysia (96.7%, a difference of 0.020%).
| Demographics | Rating | Rank | 6th Grade |
| Paiute | 7.8 /100 | #216 | Tragic 96.8% |
| Liberians | 7.5 /100 | #217 | Tragic 96.8% |
| Navajo | 7.3 /100 | #218 | Tragic 96.8% |
| Costa Ricans | 6.8 /100 | #219 | Tragic 96.8% |
| Immigrants | Morocco | 6.2 /100 | #220 | Tragic 96.7% |
| Tongans | 6.1 /100 | #221 | Tragic 96.7% |
| Immigrants | Syria | 5.9 /100 | #222 | Tragic 96.7% |
| Bahamians | 4.8 /100 | #223 | Tragic 96.7% |
| Immigrants | Southern Europe | 4.4 /100 | #224 | Tragic 96.7% |
| Immigrants | Pakistan | 4.4 /100 | #225 | Tragic 96.7% |
| Immigrants | Panama | 4.2 /100 | #226 | Tragic 96.7% |
| Immigrants | Western Asia | 4.1 /100 | #227 | Tragic 96.7% |
| Immigrants | Malaysia | 4.0 /100 | #228 | Tragic 96.7% |
| Assyrians/Chaldeans/Syriacs | 4.0 /100 | #229 | Tragic 96.7% |
| Immigrants | Eastern Asia | 4.0 /100 | #230 | Tragic 96.7% |