Portuguese vs Immigrants from Netherlands Single Father Poverty
COMPARE
Portuguese
Immigrants from Netherlands
Single Father Poverty
Single Father Poverty Comparison
Portuguese
Immigrants from Netherlands
16.2%
SINGLE FATHER POVERTY
62.3/ 100
METRIC RATING
158th/ 347
METRIC RANK
16.0%
SINGLE FATHER POVERTY
85.3/ 100
METRIC RATING
140th/ 347
METRIC RANK
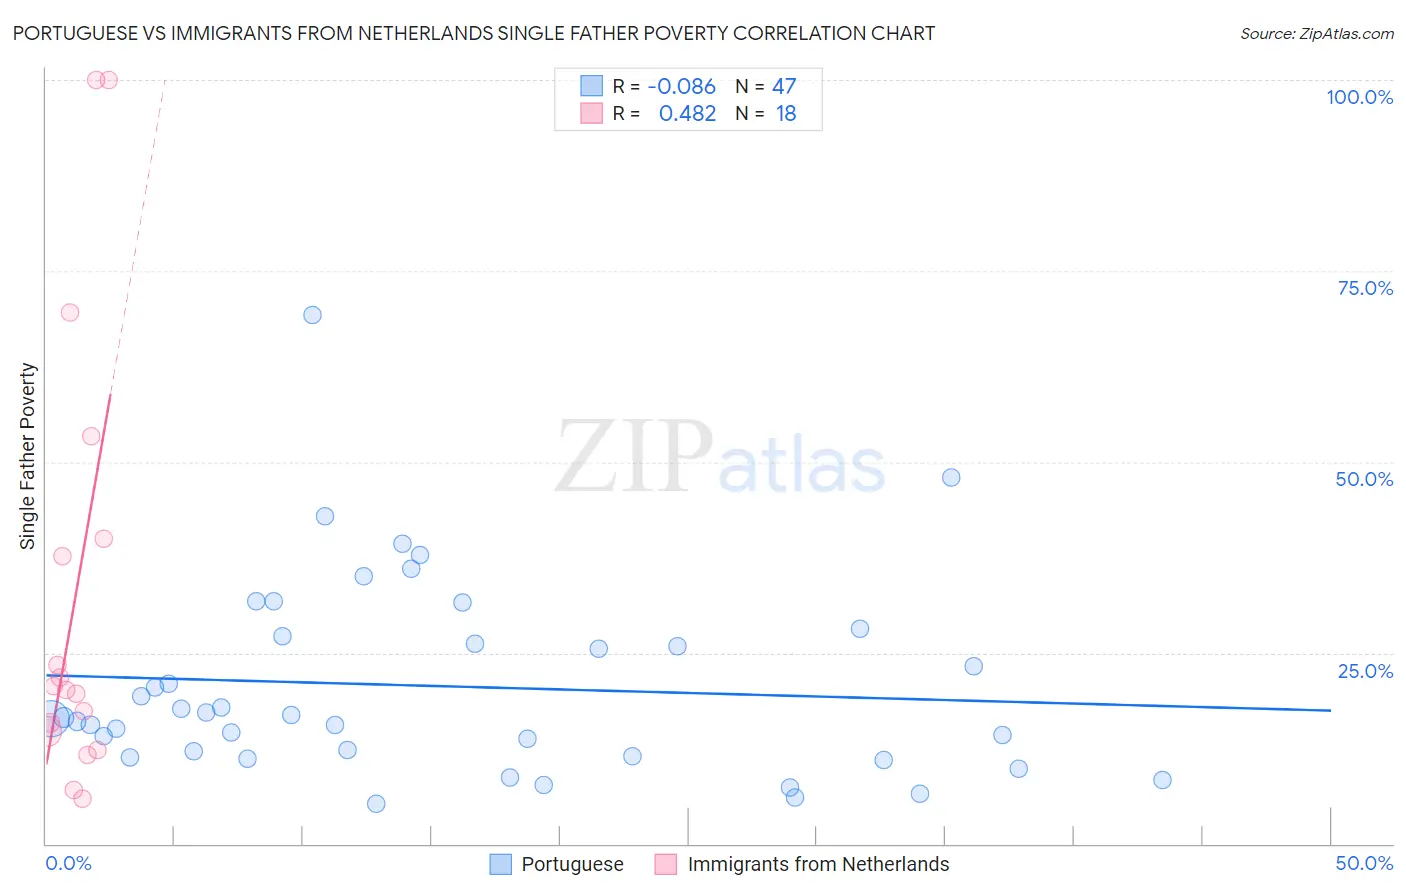
Portuguese vs Immigrants from Netherlands Single Father Poverty Correlation Chart
The statistical analysis conducted on geographies consisting of 344,973,459 people shows a slight negative correlation between the proportion of Portuguese and poverty level among single fathers in the United States with a correlation coefficient (R) of -0.086 and weighted average of 16.2%. Similarly, the statistical analysis conducted on geographies consisting of 195,225,242 people shows a moderate positive correlation between the proportion of Immigrants from Netherlands and poverty level among single fathers in the United States with a correlation coefficient (R) of 0.482 and weighted average of 16.0%, a difference of 1.4%.
Single Father Poverty Correlation Summary
| Measurement | Portuguese | Immigrants from Netherlands |
| Minimum | 5.2% | 6.0% |
| Maximum | 69.3% | 100.0% |
| Range | 64.1% | 94.0% |
| Mean | 20.6% | 32.8% |
| Median | 16.6% | 20.4% |
| Interquartile 25% (IQ1) | 11.5% | 14.7% |
| Interquartile 75% (IQ3) | 27.1% | 40.0% |
| Interquartile Range (IQR) | 15.6% | 25.3% |
| Standard Deviation (Sample) | 12.8% | 29.4% |
| Standard Deviation (Population) | 12.6% | 28.6% |
Demographics Similar to Portuguese and Immigrants from Netherlands by Single Father Poverty
In terms of single father poverty, the demographic groups most similar to Portuguese are Immigrants from Czechoslovakia (16.2%, a difference of 0.020%), Belizean (16.2%, a difference of 0.11%), Immigrants from Jordan (16.2%, a difference of 0.18%), Immigrants from Nicaragua (16.2%, a difference of 0.27%), and Mexican (16.1%, a difference of 0.39%). Similarly, the demographic groups most similar to Immigrants from Netherlands are South American (16.0%, a difference of 0.050%), Liberian (16.0%, a difference of 0.17%), Immigrants from Mexico (16.0%, a difference of 0.17%), Immigrants from Central America (16.0%, a difference of 0.19%), and Immigrants from Kuwait (16.0%, a difference of 0.32%).
| Demographics | Rating | Rank | Single Father Poverty |
| South Americans | 85.9 /100 | #139 | Excellent 16.0% |
| Immigrants | Netherlands | 85.3 /100 | #140 | Excellent 16.0% |
| Liberians | 83.3 /100 | #141 | Excellent 16.0% |
| Immigrants | Mexico | 83.3 /100 | #142 | Excellent 16.0% |
| Immigrants | Central America | 83.1 /100 | #143 | Excellent 16.0% |
| Immigrants | Kuwait | 81.4 /100 | #144 | Excellent 16.0% |
| Immigrants | Western Asia | 80.7 /100 | #145 | Excellent 16.0% |
| Immigrants | Hungary | 78.3 /100 | #146 | Good 16.1% |
| Colombians | 77.1 /100 | #147 | Good 16.1% |
| Nigerians | 76.8 /100 | #148 | Good 16.1% |
| South Africans | 75.1 /100 | #149 | Good 16.1% |
| Jordanians | 74.2 /100 | #150 | Good 16.1% |
| Immigrants | France | 73.1 /100 | #151 | Good 16.1% |
| Immigrants | Zimbabwe | 72.1 /100 | #152 | Good 16.1% |
| Immigrants | Israel | 72.0 /100 | #153 | Good 16.1% |
| Mexicans | 70.1 /100 | #154 | Good 16.1% |
| Immigrants | Nicaragua | 67.8 /100 | #155 | Good 16.2% |
| Immigrants | Jordan | 66.0 /100 | #156 | Good 16.2% |
| Immigrants | Czechoslovakia | 62.8 /100 | #157 | Good 16.2% |
| Portuguese | 62.3 /100 | #158 | Good 16.2% |
| Belizeans | 59.9 /100 | #159 | Average 16.2% |