Portuguese vs Immigrants from Netherlands Poverty
COMPARE
Portuguese
Immigrants from Netherlands
Poverty
Poverty Comparison
Portuguese
Immigrants from Netherlands
11.6%
POVERTY
92.1/ 100
METRIC RATING
105th/ 347
METRIC RANK
11.2%
POVERTY
97.5/ 100
METRIC RATING
66th/ 347
METRIC RANK
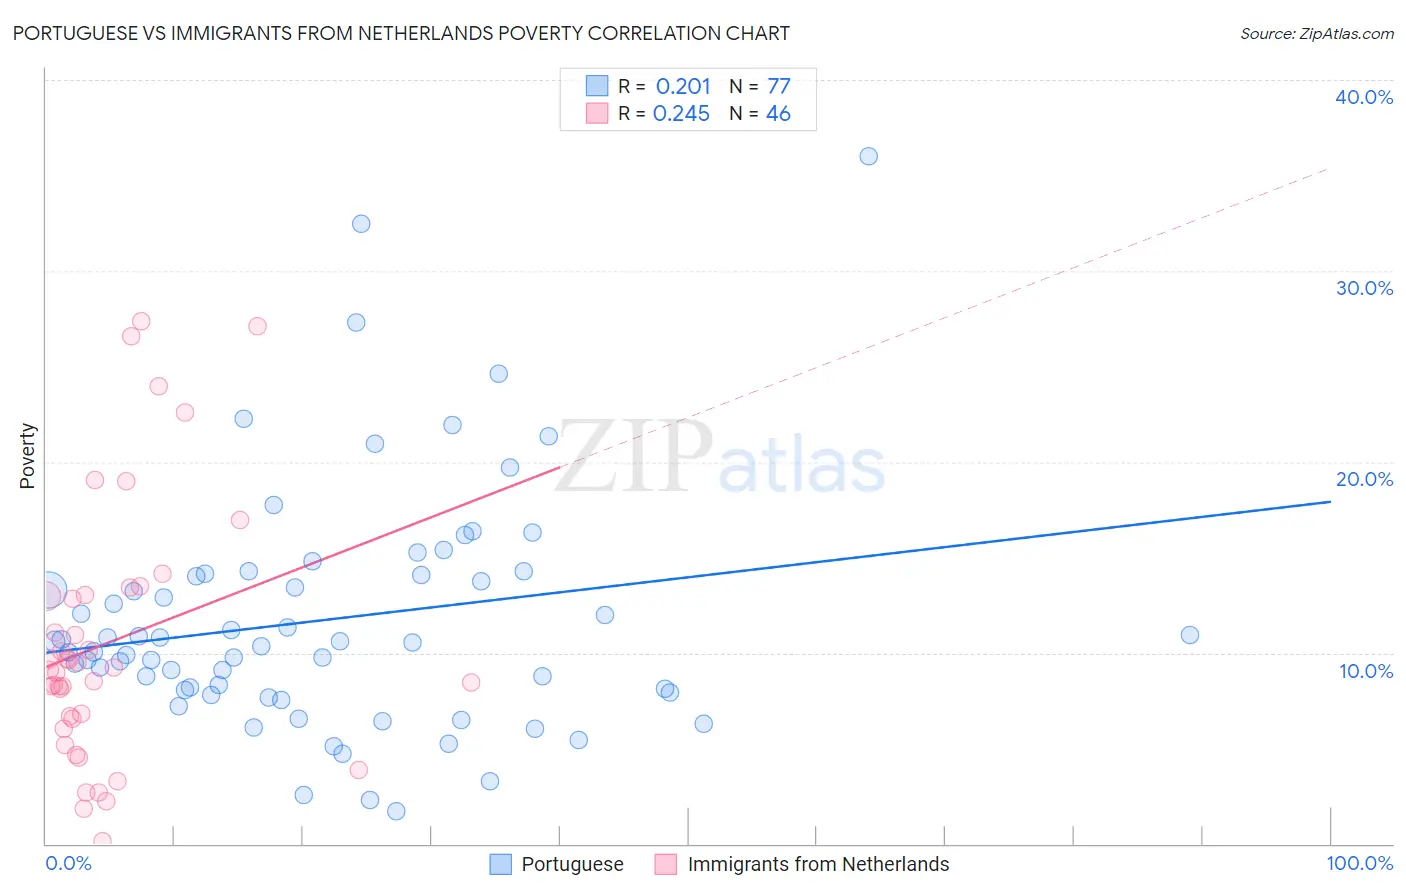
Portuguese vs Immigrants from Netherlands Poverty Correlation Chart
The statistical analysis conducted on geographies consisting of 449,939,658 people shows a weak positive correlation between the proportion of Portuguese and poverty level in the United States with a correlation coefficient (R) of 0.201 and weighted average of 11.6%. Similarly, the statistical analysis conducted on geographies consisting of 237,819,327 people shows a weak positive correlation between the proportion of Immigrants from Netherlands and poverty level in the United States with a correlation coefficient (R) of 0.245 and weighted average of 11.2%, a difference of 3.2%.
Poverty Correlation Summary
| Measurement | Portuguese | Immigrants from Netherlands |
| Minimum | 1.7% | 0.13% |
| Maximum | 36.0% | 27.4% |
| Range | 34.3% | 27.2% |
| Mean | 11.7% | 10.6% |
| Median | 10.5% | 9.2% |
| Interquartile 25% (IQ1) | 8.0% | 6.6% |
| Interquartile 75% (IQ3) | 14.1% | 13.0% |
| Interquartile Range (IQR) | 6.1% | 6.4% |
| Standard Deviation (Sample) | 6.3% | 6.8% |
| Standard Deviation (Population) | 6.2% | 6.7% |
Similar Demographics by Poverty
Demographics Similar to Portuguese by Poverty
In terms of poverty, the demographic groups most similar to Portuguese are Immigrants from Zimbabwe (11.6%, a difference of 0.0%), Native Hawaiian (11.6%, a difference of 0.020%), Palestinian (11.6%, a difference of 0.090%), Laotian (11.6%, a difference of 0.13%), and Okinawan (11.6%, a difference of 0.13%).
| Demographics | Rating | Rank | Poverty |
| Immigrants | Latvia | 94.5 /100 | #98 | Exceptional 11.5% |
| Immigrants | Indonesia | 94.2 /100 | #99 | Exceptional 11.5% |
| Scottish | 94.0 /100 | #100 | Exceptional 11.5% |
| Slavs | 93.3 /100 | #101 | Exceptional 11.5% |
| Laotians | 92.4 /100 | #102 | Exceptional 11.6% |
| Okinawans | 92.4 /100 | #103 | Exceptional 11.6% |
| Native Hawaiians | 92.1 /100 | #104 | Exceptional 11.6% |
| Portuguese | 92.1 /100 | #105 | Exceptional 11.6% |
| Immigrants | Zimbabwe | 92.1 /100 | #106 | Exceptional 11.6% |
| Palestinians | 91.8 /100 | #107 | Exceptional 11.6% |
| Canadians | 91.7 /100 | #108 | Exceptional 11.6% |
| Immigrants | Turkey | 91.7 /100 | #109 | Exceptional 11.6% |
| Welsh | 91.6 /100 | #110 | Exceptional 11.6% |
| French Canadians | 91.0 /100 | #111 | Exceptional 11.6% |
| Immigrants | Southern Europe | 90.8 /100 | #112 | Exceptional 11.6% |
Demographics Similar to Immigrants from Netherlands by Poverty
In terms of poverty, the demographic groups most similar to Immigrants from Netherlands are Immigrants from Australia (11.2%, a difference of 0.040%), Slovak (11.2%, a difference of 0.060%), Immigrants from Asia (11.2%, a difference of 0.070%), Serbian (11.2%, a difference of 0.12%), and Swiss (11.2%, a difference of 0.20%).
| Demographics | Rating | Rank | Poverty |
| Immigrants | Europe | 98.0 /100 | #59 | Exceptional 11.2% |
| Immigrants | Sri Lanka | 97.9 /100 | #60 | Exceptional 11.2% |
| Immigrants | Italy | 97.9 /100 | #61 | Exceptional 11.2% |
| Austrians | 97.8 /100 | #62 | Exceptional 11.2% |
| Ukrainians | 97.8 /100 | #63 | Exceptional 11.2% |
| Swiss | 97.7 /100 | #64 | Exceptional 11.2% |
| Immigrants | Asia | 97.5 /100 | #65 | Exceptional 11.2% |
| Immigrants | Netherlands | 97.5 /100 | #66 | Exceptional 11.2% |
| Immigrants | Australia | 97.4 /100 | #67 | Exceptional 11.2% |
| Slovaks | 97.4 /100 | #68 | Exceptional 11.2% |
| Serbians | 97.4 /100 | #69 | Exceptional 11.2% |
| Immigrants | Canada | 97.3 /100 | #70 | Exceptional 11.3% |
| Zimbabweans | 97.3 /100 | #71 | Exceptional 11.3% |
| Europeans | 97.2 /100 | #72 | Exceptional 11.3% |
| Immigrants | Belgium | 97.2 /100 | #73 | Exceptional 11.3% |