Portuguese vs Immigrants from Burma/Myanmar Single Father Poverty
COMPARE
Portuguese
Immigrants from Burma/Myanmar
Single Father Poverty
Single Father Poverty Comparison
Portuguese
Immigrants from Burma/Myanmar
16.2%
SINGLE FATHER POVERTY
62.3/ 100
METRIC RATING
158th/ 347
METRIC RANK
16.5%
SINGLE FATHER POVERTY
28.0/ 100
METRIC RATING
190th/ 347
METRIC RANK
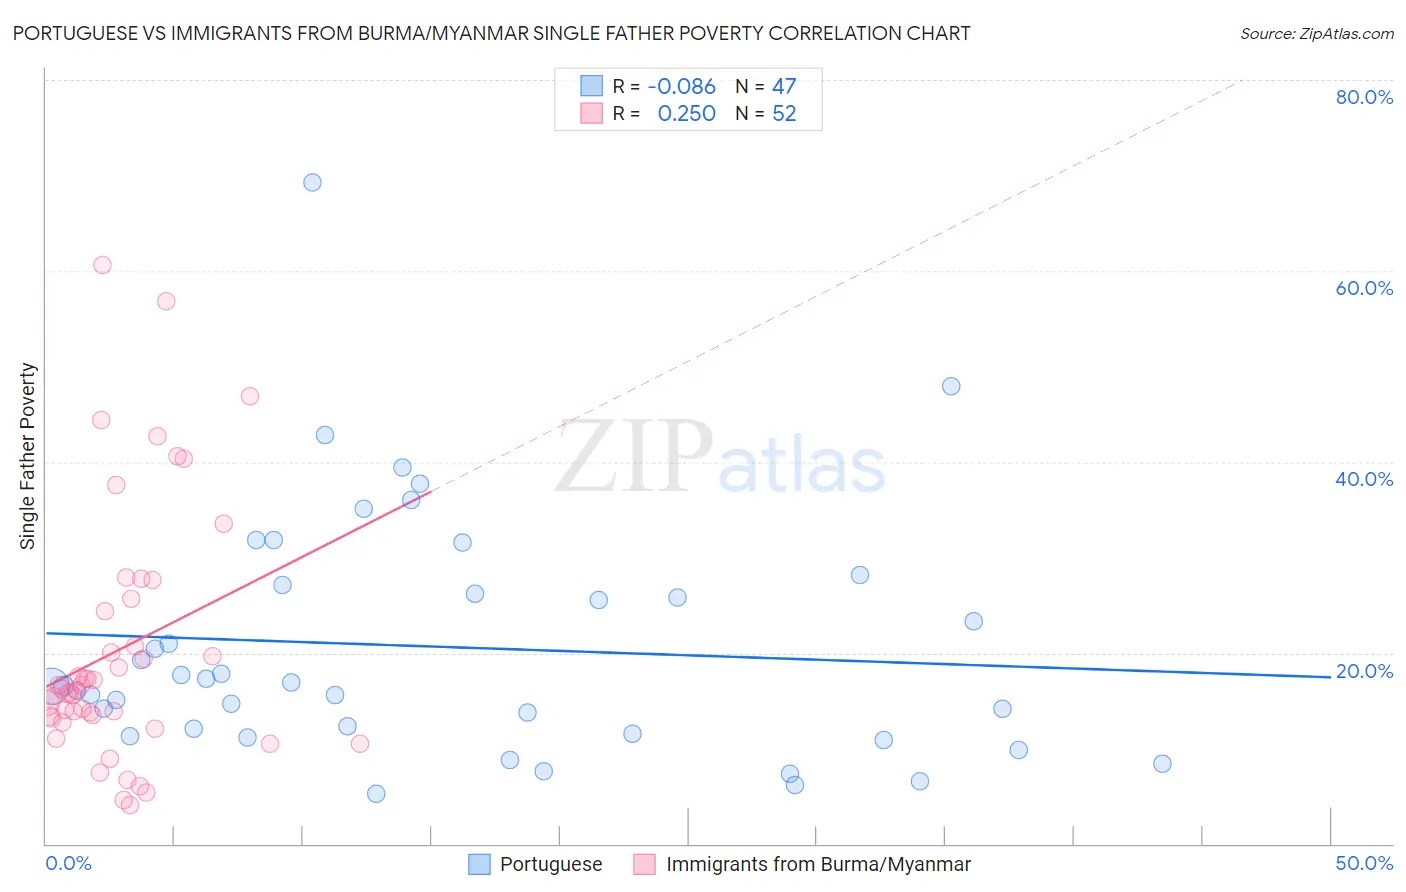
Portuguese vs Immigrants from Burma/Myanmar Single Father Poverty Correlation Chart
The statistical analysis conducted on geographies consisting of 344,973,459 people shows a slight negative correlation between the proportion of Portuguese and poverty level among single fathers in the United States with a correlation coefficient (R) of -0.086 and weighted average of 16.2%. Similarly, the statistical analysis conducted on geographies consisting of 151,197,682 people shows a weak positive correlation between the proportion of Immigrants from Burma/Myanmar and poverty level among single fathers in the United States with a correlation coefficient (R) of 0.250 and weighted average of 16.5%, a difference of 1.6%.
Single Father Poverty Correlation Summary
| Measurement | Portuguese | Immigrants from Burma/Myanmar |
| Minimum | 5.2% | 4.1% |
| Maximum | 69.3% | 60.6% |
| Range | 64.1% | 56.5% |
| Mean | 20.6% | 20.3% |
| Median | 16.6% | 16.1% |
| Interquartile 25% (IQ1) | 11.5% | 13.3% |
| Interquartile 75% (IQ3) | 27.1% | 25.0% |
| Interquartile Range (IQR) | 15.6% | 11.8% |
| Standard Deviation (Sample) | 12.8% | 13.0% |
| Standard Deviation (Population) | 12.6% | 12.9% |
Similar Demographics by Single Father Poverty
Demographics Similar to Portuguese by Single Father Poverty
In terms of single father poverty, the demographic groups most similar to Portuguese are Immigrants from Czechoslovakia (16.2%, a difference of 0.020%), Belizean (16.2%, a difference of 0.11%), Immigrants from Sudan (16.2%, a difference of 0.12%), Immigrants from Jordan (16.2%, a difference of 0.18%), and Estonian (16.2%, a difference of 0.26%).
| Demographics | Rating | Rank | Single Father Poverty |
| Immigrants | France | 73.1 /100 | #151 | Good 16.1% |
| Immigrants | Zimbabwe | 72.1 /100 | #152 | Good 16.1% |
| Immigrants | Israel | 72.0 /100 | #153 | Good 16.1% |
| Mexicans | 70.1 /100 | #154 | Good 16.1% |
| Immigrants | Nicaragua | 67.8 /100 | #155 | Good 16.2% |
| Immigrants | Jordan | 66.0 /100 | #156 | Good 16.2% |
| Immigrants | Czechoslovakia | 62.8 /100 | #157 | Good 16.2% |
| Portuguese | 62.3 /100 | #158 | Good 16.2% |
| Belizeans | 59.9 /100 | #159 | Average 16.2% |
| Immigrants | Sudan | 59.8 /100 | #160 | Average 16.2% |
| Estonians | 56.7 /100 | #161 | Average 16.2% |
| Ugandans | 55.9 /100 | #162 | Average 16.3% |
| Immigrants | Costa Rica | 55.7 /100 | #163 | Average 16.3% |
| Guyanese | 55.2 /100 | #164 | Average 16.3% |
| Immigrants | Bangladesh | 55.1 /100 | #165 | Average 16.3% |
Demographics Similar to Immigrants from Burma/Myanmar by Single Father Poverty
In terms of single father poverty, the demographic groups most similar to Immigrants from Burma/Myanmar are Latvian (16.5%, a difference of 0.050%), Immigrants from Guyana (16.5%, a difference of 0.050%), Russian (16.4%, a difference of 0.11%), Ukrainian (16.4%, a difference of 0.12%), and Immigrants from Venezuela (16.4%, a difference of 0.16%).
| Demographics | Rating | Rank | Single Father Poverty |
| Aleuts | 35.3 /100 | #183 | Fair 16.4% |
| Cambodians | 34.6 /100 | #184 | Fair 16.4% |
| Panamanians | 33.6 /100 | #185 | Fair 16.4% |
| Immigrants | Venezuela | 31.0 /100 | #186 | Fair 16.4% |
| Ukrainians | 30.4 /100 | #187 | Fair 16.4% |
| Russians | 30.1 /100 | #188 | Fair 16.4% |
| Latvians | 28.9 /100 | #189 | Fair 16.5% |
| Immigrants | Burma/Myanmar | 28.0 /100 | #190 | Fair 16.5% |
| Immigrants | Guyana | 27.1 /100 | #191 | Fair 16.5% |
| Immigrants | Switzerland | 24.8 /100 | #192 | Fair 16.5% |
| Ecuadorians | 24.5 /100 | #193 | Fair 16.5% |
| Cape Verdeans | 24.4 /100 | #194 | Fair 16.5% |
| Immigrants | Barbados | 24.3 /100 | #195 | Fair 16.5% |
| Immigrants | Canada | 21.9 /100 | #196 | Fair 16.5% |
| Immigrants | Northern Europe | 20.3 /100 | #197 | Fair 16.5% |